Technical Analysis of CUZ 2024-05-10
Overview:
In analyzing the technical indicators for CUZ over the last 5 days, we will delve into the trend, momentum, volatility, and volume indicators to provide a comprehensive outlook on the possible stock price movement in the coming days. By examining these key aspects, we aim to offer valuable insights and predictions for potential investors.
Trend Analysis:
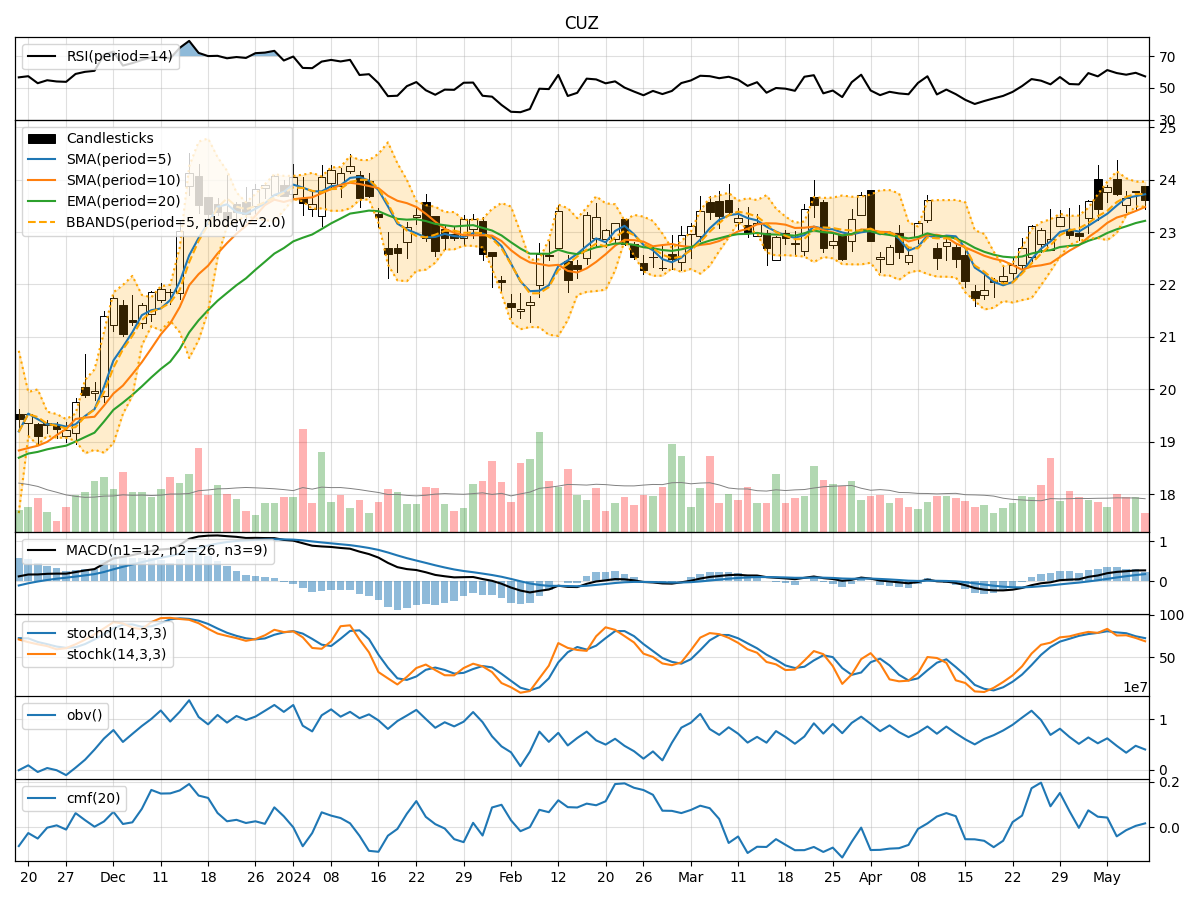
- Moving Averages (MA): The moving averages have been showing an upward trend, with the 5-day MA consistently above the 10-day SMA, indicating a positive momentum in the stock price.
- MACD: The MACD line has been above the signal line for the past few days, suggesting a bullish trend in the short term.
Momentum Analysis:
- RSI: The RSI has been fluctuating around the 50 level, indicating a neutral momentum in the stock.
- Stochastic Oscillator: The stochastic indicators have been showing a downward trend, suggesting a potential reversal in the stock price momentum.
Volatility Analysis:
- Bollinger Bands (BB): The Bollinger Bands have been narrowing, indicating decreasing volatility in the stock price.
Volume Analysis:
- On-Balance Volume (OBV): The OBV has been fluctuating, indicating a balance between buying and selling pressure.
- Chaikin Money Flow (CMF): The CMF has been slightly negative, suggesting a slight outflow of money from the stock.
Key Observations:
- The trend indicators suggest a bullish sentiment in the short term.
- Momentum indicators show a neutral to slightly bearish outlook.
- Volatility is decreasing, indicating a potential consolidation phase.
- Volume indicators reflect a balanced buying and selling pressure.
Conclusion:
Based on the analysis of the technical indicators, the next few days' possible stock price movement for CUZ is likely to be sideways with a slight bearish bias. Investors should closely monitor the trend indicators for any potential reversal signals and keep an eye on the momentum indicators for confirmation. Additionally, the decreasing volatility suggests a period of consolidation, while the volume indicators indicate a balanced market sentiment. It is advisable to wait for clearer signals before making any significant trading decisions.