Technical Analysis of CW 2024-05-10
Overview:
In analyzing the technical indicators for the last 5 days of CW stock, we will delve into the trend, momentum, volatility, and volume indicators to provide a comprehensive outlook on the possible stock price movement in the upcoming days. By examining these key indicators, we aim to offer valuable insights and predictions to guide your investment decisions.
Trend Indicators:
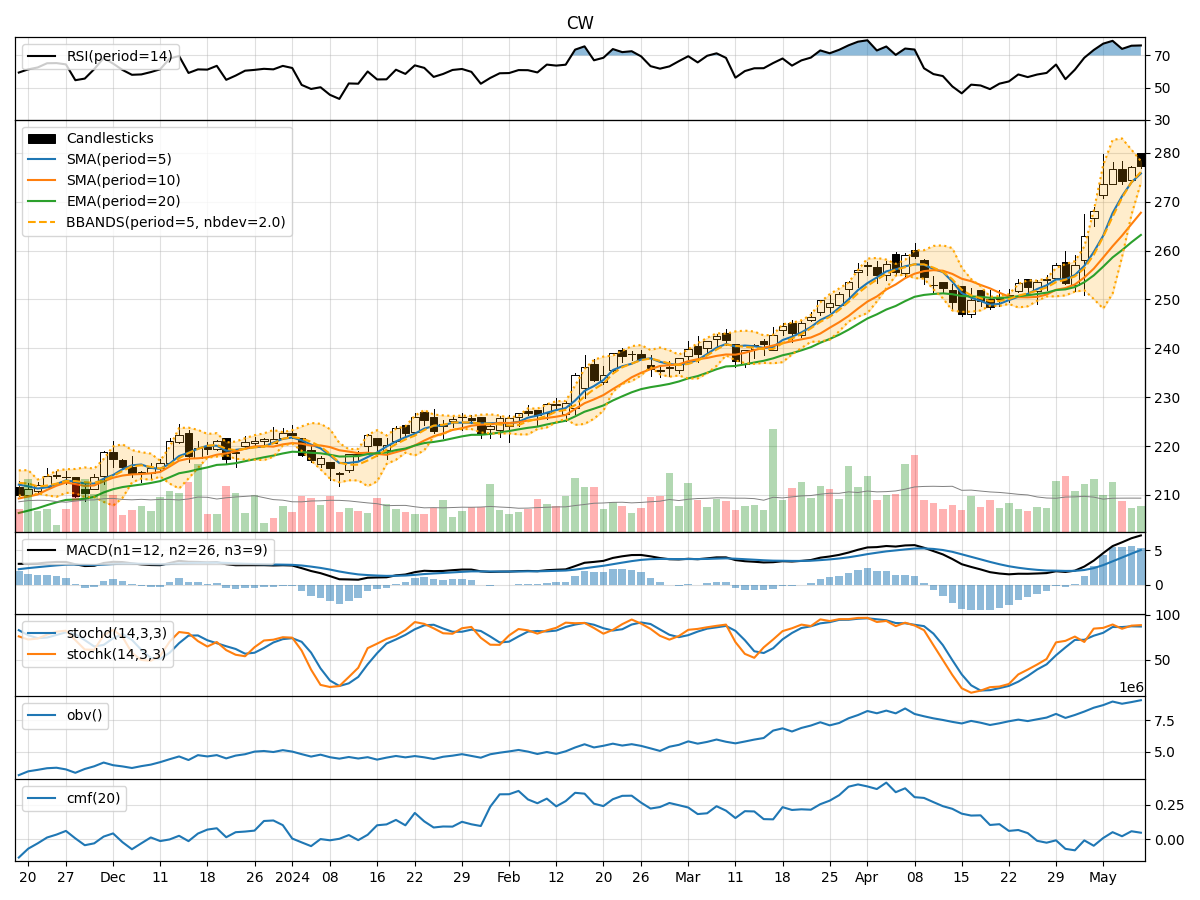
- Moving Averages (MA): The 5-day moving average has been consistently trending upwards, indicating a bullish momentum in the short term.
- MACD: The MACD line has been increasing, suggesting a strengthening bullish trend.
- EMA: The exponential moving average has also been on an upward trajectory, supporting the bullish sentiment.
Momentum Indicators:
- RSI: The Relative Strength Index has been in the overbought territory, signaling a strong bullish momentum.
- Stochastic Oscillator: Both %K and %D have been in the overbought zone, indicating a potential reversal or consolidation.
- Williams %R: The Williams %R is in the oversold region, suggesting a possible reversal to the upside.
Volatility Indicators:
- Bollinger Bands: The stock price has been trading near the upper Bollinger Band, indicating high volatility and a potential overbought condition.
- Bollinger Band Width: The Band Width has been narrowing, suggesting a possible decrease in volatility and a period of consolidation.
Volume Indicators:
- On-Balance Volume (OBV): The OBV has been increasing, indicating strong buying pressure and accumulation of the stock.
- Chaikin Money Flow (CMF): The CMF has been positive, reflecting buying interest and potential price appreciation.
Key Observations and Opinions:
- Trend: The trend indicators suggest a strong bullish sentiment in the short term.
- Momentum: While momentum indicators show overbought conditions, the bullish momentum is still prevalent.
- Volatility: High volatility near the upper Bollinger Band may lead to a period of consolidation or a slight pullback.
- Volume: Increasing OBV and positive CMF indicate strong buying interest and potential further price appreciation.
Conclusion:
Based on the analysis of the technical indicators, the stock is likely to experience a continuation of the bullish trend in the next few days. However, given the overbought conditions in some momentum indicators and high volatility near the upper Bollinger Band, we may see a temporary consolidation or a minor pullback before the uptrend resumes. It is advisable to monitor the price action closely for any signs of reversal or continuation of the current trend.