Technical Analysis of CWK 2024-05-10
Overview:
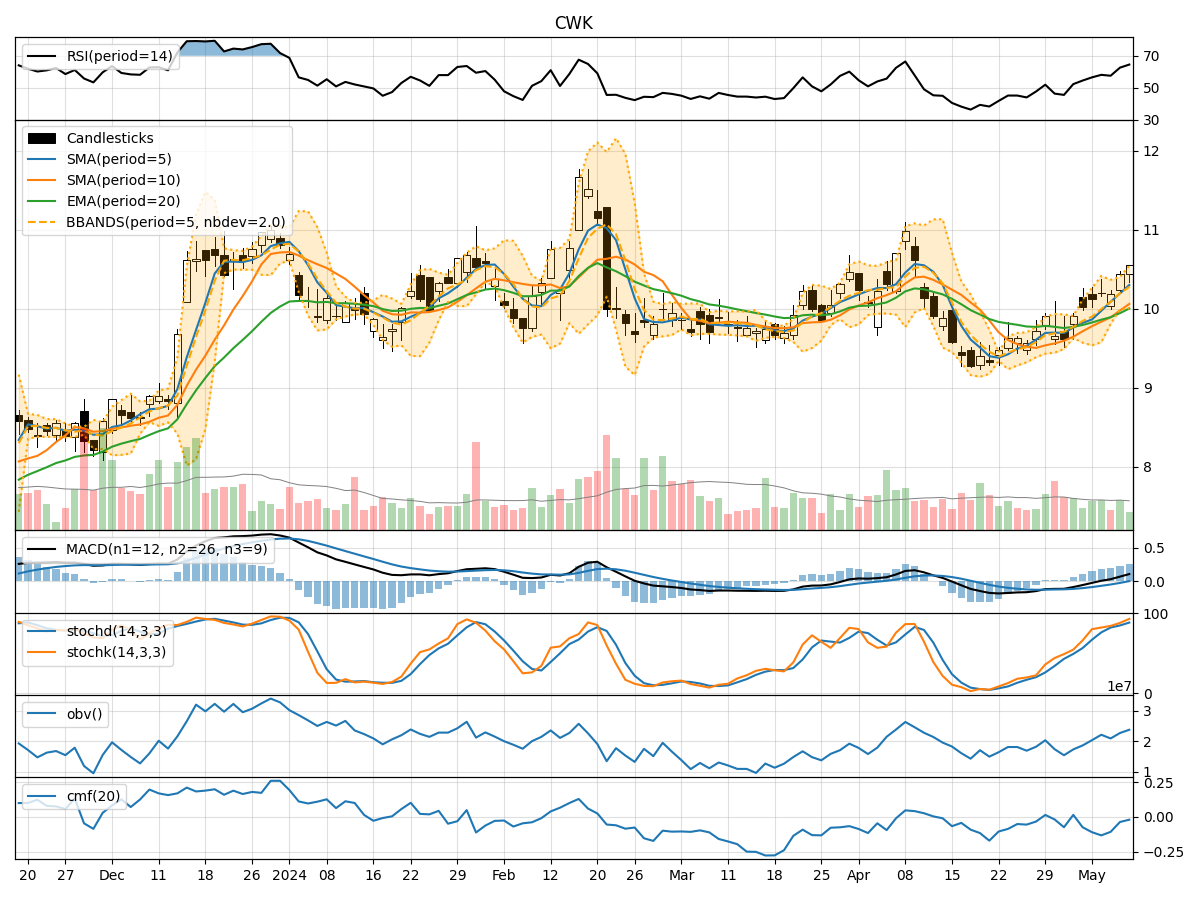
In analyzing the technical indicators for CWK over the last 5 days, we will delve into the trend, momentum, volatility, and volume indicators to provide a comprehensive outlook on the possible stock price movement. By examining these key aspects, we aim to offer valuable insights and predictions for the upcoming days.
Trend Analysis:
- Moving Averages (MA): The 5-day Moving Average has been consistently rising, indicating a bullish trend in the short term.
- MACD: The MACD line has been above the signal line for the past 5 days, suggesting a bullish momentum.
- Relative Strength Index (RSI): The RSI values have been increasing, reflecting strengthening buying pressure.
Momentum Analysis:
- Stochastic Oscillator: Both %K and %D values have been rising, indicating increasing buying momentum.
- Williams %R (WillR): The Williams %R values have been improving, signaling a potential bullish reversal.
Volatility Analysis:
- Bollinger Bands (BB): The stock price has been trading within the upper Bollinger Band, suggesting an overbought condition.
- Bollinger Band Percentage (BBP): The BBP values have been fluctuating, indicating potential price volatility.
Volume Analysis:
- On-Balance Volume (OBV): The OBV values have been increasing, indicating accumulation by investors.
- Chaikin Money Flow (CMF): The CMF values have been negative, suggesting some selling pressure.
Key Observations:
- The trend indicators show a strong bullish sentiment in the short term.
- Momentum indicators indicate increasing buying momentum and potential for a bullish reversal.
- Volatility indicators suggest a potential for price volatility due to the overbought condition.
- Volume indicators show accumulation by investors but also some selling pressure.
Conclusion:
Based on the analysis of the technical indicators, the next few days for CWK stock are likely to see continued upward movement. The bullish trend, positive momentum, and potential for a bullish reversal indicate a favorable outlook for the stock price. However, investors should be cautious of potential price volatility due to the overbought condition indicated by the Bollinger Bands. Overall, the stock is poised for further upside potential in the near term.