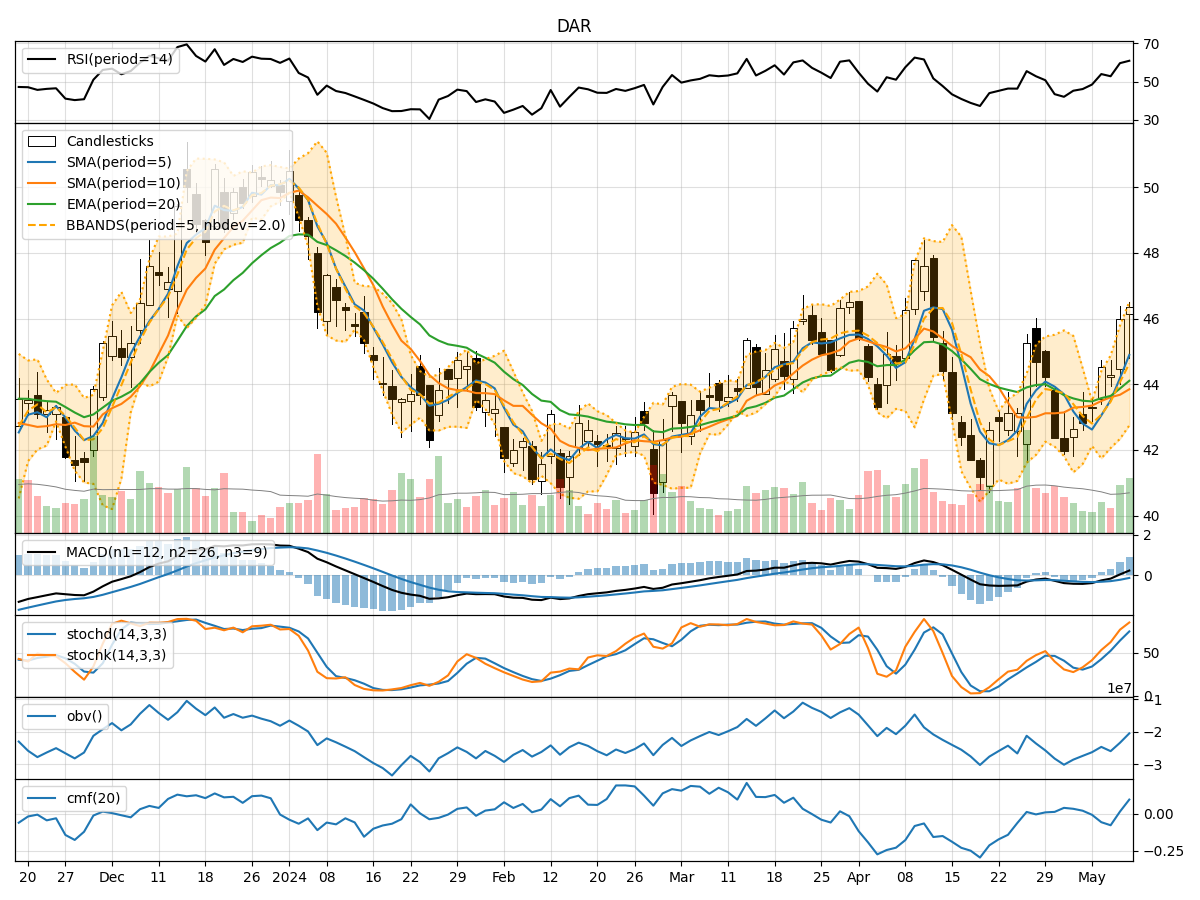
Technical Analysis of DAR 2024-05-10
Overview:
In the last 5 trading days, DAR stock has shown a consistent upward trend in price, accompanied by increasing volume. The moving averages indicate a positive momentum, with the MACD showing a bullish crossover. The RSI and Stochastic indicators suggest the stock is in overbought territory, while the Bollinger Bands show an expanding range.
Trend Indicators:
- Moving Averages (MA): The 5-day MA has been consistently above the closing price, indicating a bullish trend.
- MACD: The MACD line has crossed above the signal line, signaling a bullish trend.
- MACD Histogram: The histogram is positive and increasing, indicating strengthening bullish momentum.
Key Observation: The trend indicators suggest a strong bullish sentiment in the stock.
Momentum Indicators:
- RSI: The RSI is in the overbought zone, indicating a potential reversal or consolidation.
- Stochastic Oscillator: Both %K and %D are in the overbought region, suggesting a possible pullback.
- Williams %R: The stock is in the oversold territory, indicating a potential reversal.
Key Observation: Momentum indicators suggest that the stock may experience a short-term pullback or consolidation.
Volatility Indicators:
- Bollinger Bands: The bands are widening, indicating increased volatility and potential price expansion.
- Bollinger %B: The %B is above 0.8, suggesting the stock is trading near the upper band.
Key Observation: Volatility indicators point towards potential price expansion and increased market activity.
Volume Indicators:
- On-Balance Volume (OBV): The OBV has been steadily increasing, indicating strong buying pressure.
- Chaikin Money Flow (CMF): The CMF is positive, suggesting money flow into the stock.
Key Observation: Volume indicators support the bullish trend, showing accumulation and positive money flow.
Conclusion:
Based on the technical analysis of the trend, momentum, volatility, and volume indicators, the next few days' possible stock price movement for DAR is likely to experience a short-term pullback or consolidation. The stock has been in overbought territory according to momentum indicators, suggesting a potential reversal or sideways movement. However, the overall trend remains bullish, supported by strong volume accumulation and positive trend indicators. Traders should be cautious of a possible correction in the near term before the uptrend resumes.
Key Conclusion: Short-term pullback expected, followed by a continuation of the bullish trend.