Technical Analysis of DCI 2024-05-10
Overview:
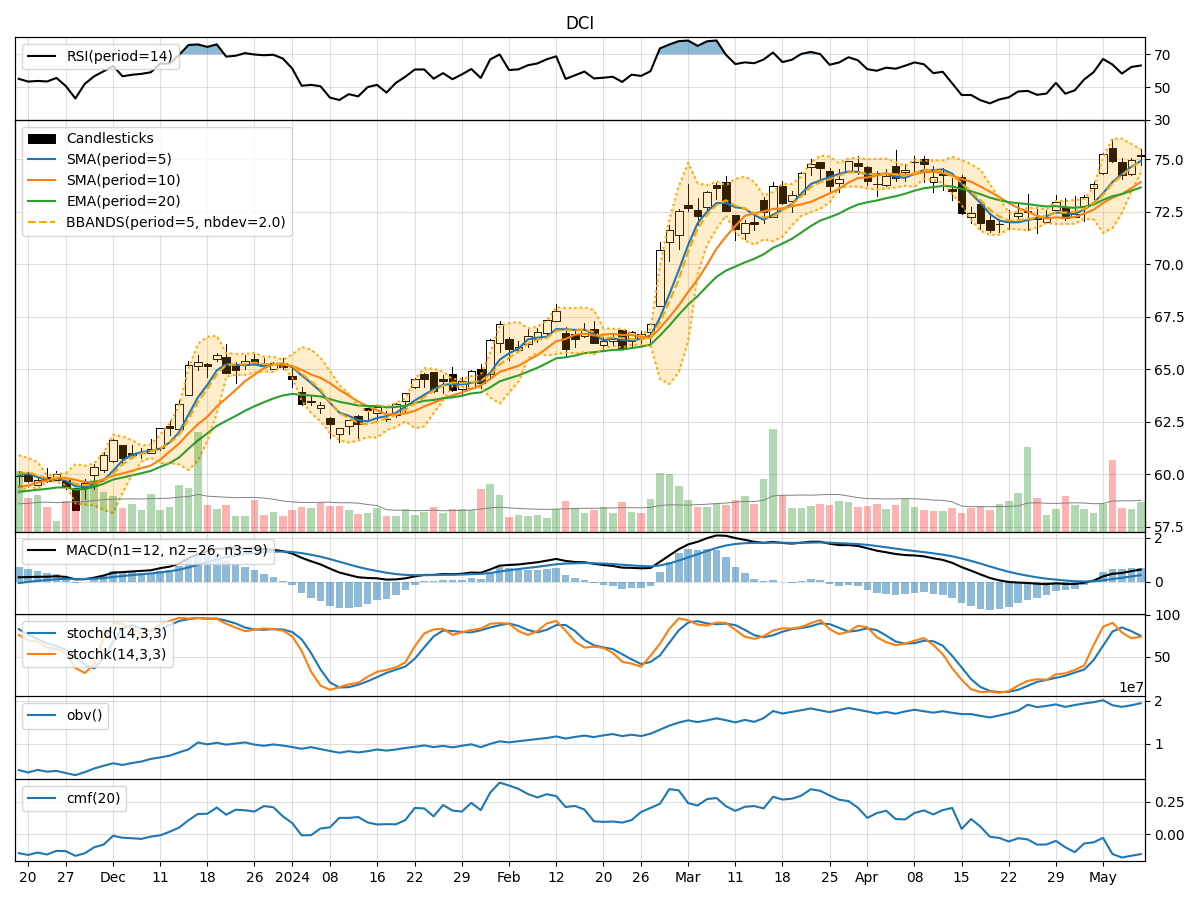
In analyzing the technical indicators for DCI over the last 5 days, we will delve into the trend, momentum, volatility, and volume indicators to provide a comprehensive outlook on the possible stock price movement. By examining these key aspects, we aim to offer valuable insights and predictions for the upcoming days.
Trend Analysis:
- Moving Averages (MA): The 5-day Moving Average (MA) has been consistently above the Simple Moving Average (SMA) and Exponential Moving Average (EMA), indicating a bullish trend.
- MACD: The MACD line has been consistently above the signal line, with both lines showing an upward trend, suggesting bullish momentum.
- RSI: The Relative Strength Index (RSI) has been fluctuating but generally staying within the neutral to slightly overbought territory, indicating a balanced market sentiment.
Momentum Analysis:
- Stochastic Oscillator: The Stochastic Oscillator has been fluctuating but generally staying within the overbought territory, suggesting potential for a pullback.
- Williams %R: The Williams %R indicator has been hovering around oversold levels, indicating a possible reversal in the short term.
Volatility Analysis:
- Bollinger Bands: The Bollinger Bands have been narrowing, indicating decreasing volatility and a potential period of consolidation.
- Volatility Bands: The Volatility Bands have been tightening, suggesting a decrease in price fluctuations.
Volume Analysis:
- On-Balance Volume (OBV): The OBV has been fluctuating but generally showing a slight decrease, indicating some distribution happening in the stock.
- Chaikin Money Flow (CMF): The CMF has been negative, suggesting that money is flowing out of the stock.
Key Observations:
- The trend indicators suggest a bullish sentiment in the short term.
- Momentum indicators show a potential for a pullback in the overbought territory.
- Volatility indicators point towards a period of consolidation with decreasing price fluctuations.
- Volume indicators indicate some distribution and outflow of money from the stock.
Conclusion:
Based on the analysis of the technical indicators, the next few days for DCI stock price movement are likely to be sideways with a slight bearish bias. Traders should be cautious of a potential pullback due to overbought conditions in momentum indicators and decreasing volatility leading to a consolidation phase. It is advisable to closely monitor key support and resistance levels for potential entry and exit points.