Technical Analysis of DDC 2024-05-10
Overview:
In analyzing the technical indicators for DDC over the last 5 days, we will delve into the trend, momentum, volatility, and volume indicators to provide a comprehensive outlook on the possible stock price movement in the coming days. By examining these key indicators, we aim to offer valuable insights and predictions for informed decision-making.
Trend Analysis:
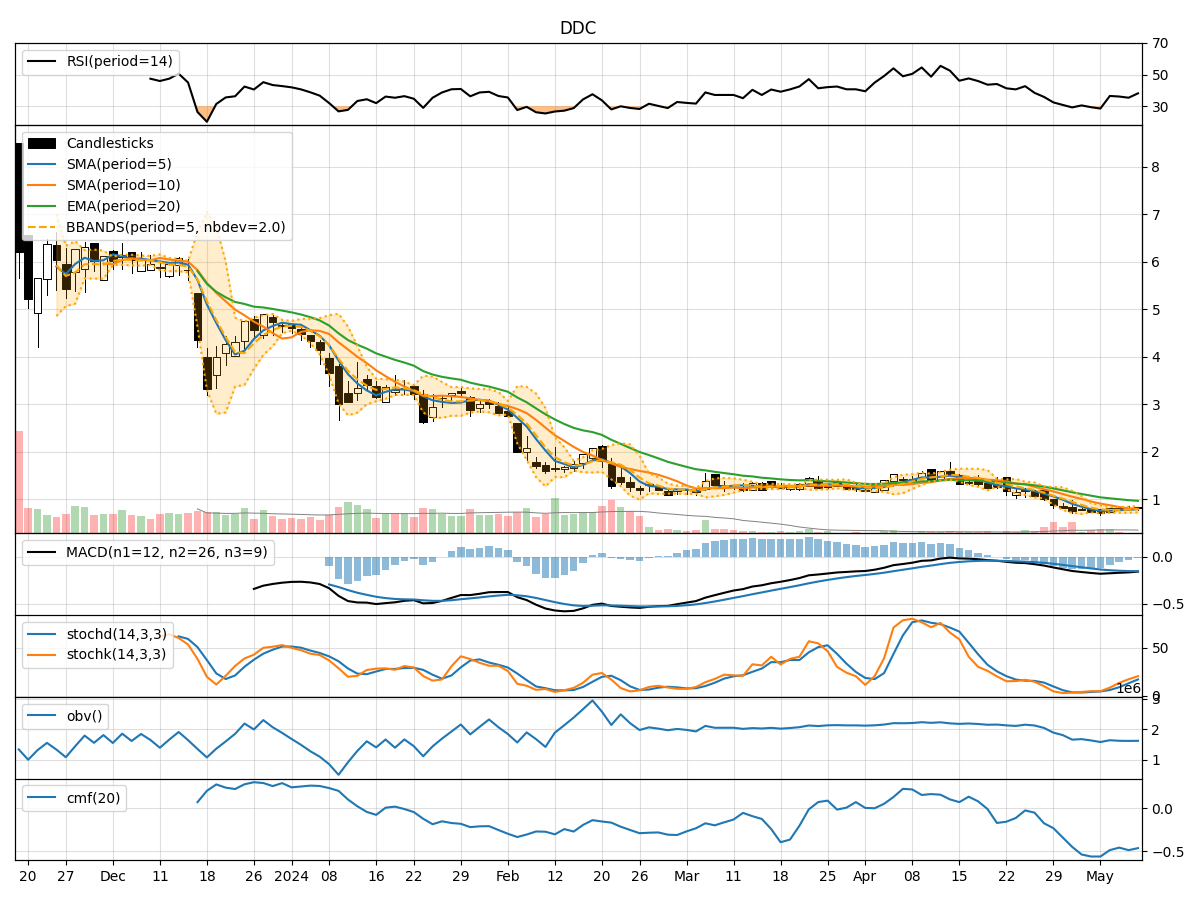
- Moving Averages (MA): The 5-day MA has been consistently below the SMA(10) and EMA(20), indicating a downward trend in the short term.
- MACD: The MACD line has been negative, with the MACD histogram showing a decreasing trend, suggesting bearish momentum.
Momentum Analysis:
- RSI: The RSI has been relatively low, indicating oversold conditions in the market.
- Stochastic Oscillator: Both %K and %D have been increasing but remain in oversold territory, signaling a potential reversal.
Volatility Analysis:
- Bollinger Bands (BB): The stock price has been trading below the lower Bollinger Band, indicating oversold conditions and potential for a reversal.
Volume Analysis:
- On-Balance Volume (OBV): The OBV has been fluctuating but has not shown a clear trend, suggesting indecision among investors.
- Chaikin Money Flow (CMF): The CMF has been negative, indicating selling pressure in the market.
Key Observations:
- The stock is currently in a downtrend based on moving averages and MACD.
- Momentum indicators suggest oversold conditions, potentially signaling a reversal.
- Volatility indicators show oversold conditions based on Bollinger Bands.
- Volume indicators reflect indecision and selling pressure in the market.
Conclusion:
Based on the analysis of the technical indicators, the stock price of DDC is likely to experience a short-term rebound in the coming days. The oversold conditions indicated by momentum and volatility indicators, coupled with the potential reversal signals from the stochastic oscillator and Bollinger Bands, suggest a possible upward movement in the stock price. However, investors should remain cautious as the overall trend is still bearish based on moving averages and MACD. It is advisable to closely monitor the price action and key indicators for confirmation of a sustained uptrend before considering any significant long positions.