Technical Analysis of DHR 2024-05-10
Overview:
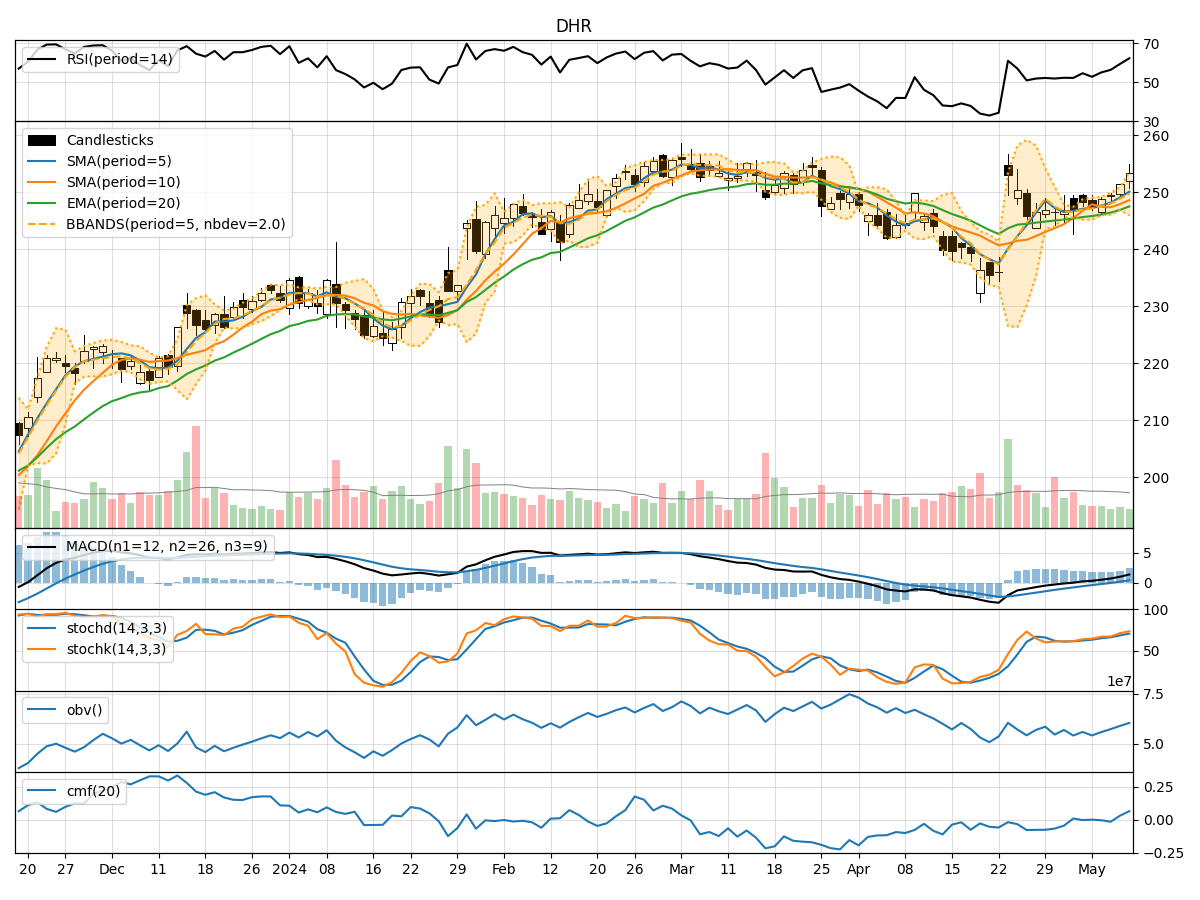
In analyzing the technical indicators for DHR over the last 5 days, we will delve into the trend, momentum, volatility, and volume indicators to provide a comprehensive outlook on the possible stock price movement in the coming days. By examining these key indicators, we aim to offer valuable insights and predictions for informed decision-making.
Trend Indicators:
- Moving Averages (MA): The 5-day MA has been consistently above the closing prices, indicating a short-term uptrend.
- MACD: The MACD line has been trending upwards, with the MACD histogram showing positive values, suggesting bullish momentum.
- EMA: The EMA has been steadily increasing, reflecting a positive trend in the stock price.
Key Observation: The trend indicators point towards a bullish sentiment in the stock price movement.
Momentum Indicators:
- RSI: The RSI has been gradually increasing and is currently in the neutral zone, indicating potential room for further upside.
- Stochastic Oscillator: Both %K and %D lines are in the overbought territory, suggesting a strong bullish momentum.
- Williams %R: The indicator is in the oversold region, signaling a potential reversal to the upside.
Key Observation: Momentum indicators suggest a bullish momentum in the stock price.
Volatility Indicators:
- Bollinger Bands: The stock price has been trading above the upper Bollinger Band, indicating an overbought condition.
- Bollinger %B: The %B indicator is above 1, signaling a potential reversal or correction in the stock price.
Key Observation: Volatility indicators hint at a possible reversal or correction in the stock price.
Volume Indicators:
- On-Balance Volume (OBV): The OBV has shown mixed signals, with some days experiencing selling pressure and others showing accumulation.
- Chaikin Money Flow (CMF): The CMF has been positive, indicating buying pressure in the stock.
Key Observation: Volume indicators suggest a mixed sentiment in the stock price movement.
Conclusion:
Based on the analysis of the technical indicators, the overall outlook for DHR in the next few days leans towards a bullish sentiment. The trend and momentum indicators strongly support a continuation of the uptrend, while volatility indicators hint at a potential reversal or correction in the short term. The volume indicators, although mixed, do not negate the bullish momentum seen in the trend and momentum indicators.
In conclusion, the next few days are likely to see a continuation of the upward trend in DHR's stock price, with the possibility of a short-term correction or consolidation due to overbought conditions indicated by volatility indicators. Investors may consider capitalizing on potential buying opportunities during any corrective phases while maintaining a bullish outlook for the stock.