Technical Analysis of DHT 2024-05-10
Overview:
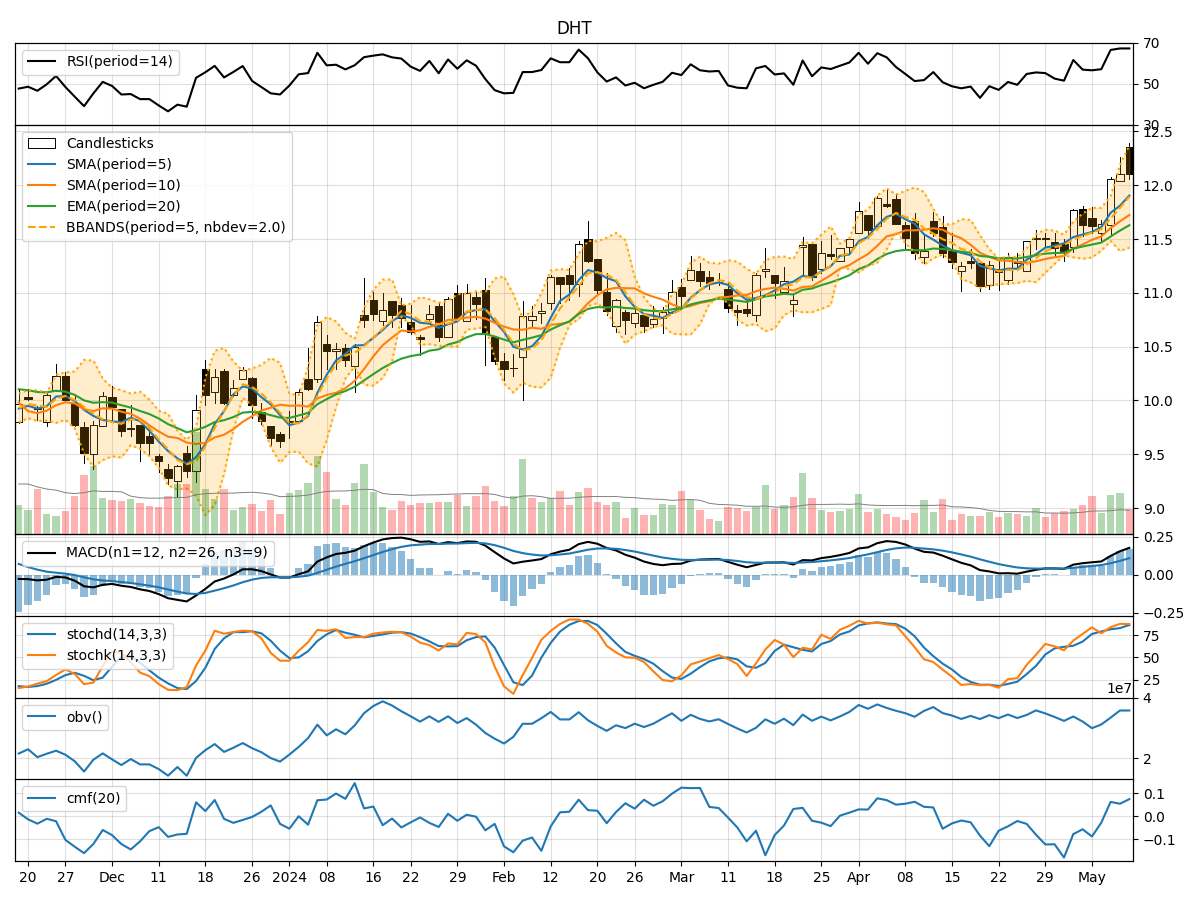
In analyzing the technical indicators for DHT over the last 5 days, we will delve into the trends, momentum, volatility, and volume aspects to provide a comprehensive outlook on the possible stock price movement. By examining key indicators such as moving averages, MACD, RSI, Bollinger Bands, and OBV, we aim to offer valuable insights and predictions for the upcoming days.
Trend Analysis:
- Moving Averages (MA): The 5-day moving average has been consistently trending upwards, indicating a positive momentum in the stock price.
- MACD: The MACD line has been above the signal line for the past 5 days, suggesting a bullish trend.
- EMA: The exponential moving average has also been on an upward trajectory, supporting the bullish sentiment.
Momentum Analysis:
- RSI: The Relative Strength Index has been hovering around 67, indicating a slightly overbought condition but still within a healthy range.
- Stochastic Oscillator: Both %K and %D have been in the overbought territory, signaling potential for a pullback.
- Williams %R: The Williams %R is in the oversold region, suggesting a possible reversal in the short term.
Volatility Analysis:
- Bollinger Bands: The stock price has been trading within the upper Bollinger Band, indicating an overbought condition.
- Bollinger Band Width: The band width has been narrowing, suggesting a potential decrease in volatility.
- Bollinger Band %B: The %B indicator is above 0.5, indicating bullish momentum.
Volume Analysis:
- On-Balance Volume (OBV): The OBV has been steadily increasing, reflecting accumulation by investors.
- Chaikin Money Flow (CMF): The CMF is positive, indicating buying pressure in the stock.
Key Observations:
- The stock is currently in an upward trend supported by moving averages and MACD.
- Momentum indicators suggest a slight overbought condition, potentially leading to a short-term pullback.
- Volatility is decreasing, indicating a possible consolidation phase.
- Volume indicators show positive accumulation and buying pressure.
Conclusion:
Based on the analysis of technical indicators, the next few days for DHT stock price movement are likely to see a consolidation phase with a potential short-term pullback due to the overbought momentum. However, the overall trend remains bullish, supported by positive volume accumulation. Traders may consider taking profits on existing positions or waiting for a dip to enter new positions. It is essential to monitor key support levels and watch for any signs of trend reversal in the coming days.