Technical Analysis of DINO 2024-05-10
Overview:
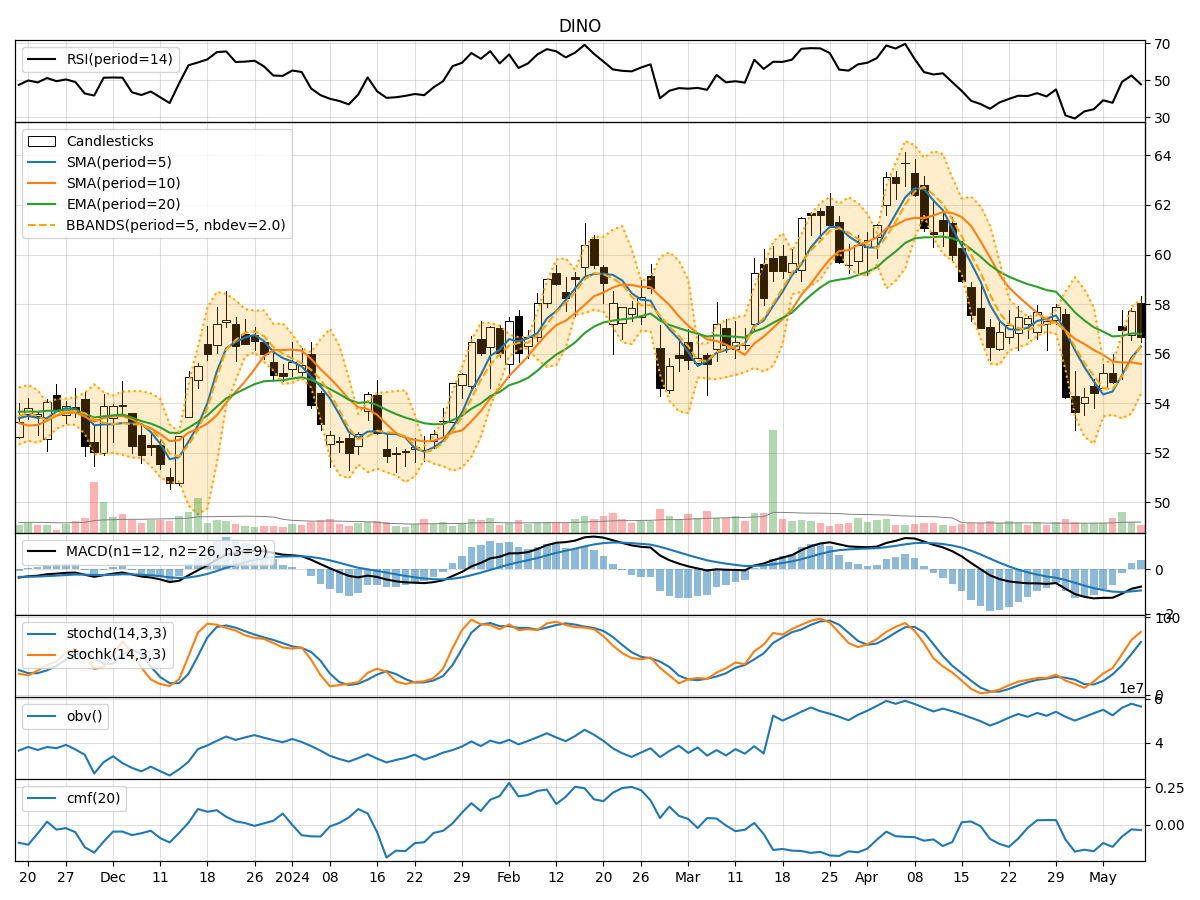
In analyzing the technical indicators for DINO stock over the last 5 days, we will delve into the trend, momentum, volatility, and volume indicators to provide a comprehensive outlook on the possible stock price movement in the coming days. By examining these key aspects, we aim to offer valuable insights and predictions for informed decision-making.
Trend Analysis:
- Moving Averages (MA): The 5-day Moving Average (MA) has been fluctuating around the closing prices, indicating short-term price trends. The Simple Moving Average (SMA) and Exponential Moving Average (EMA) show a slight divergence, suggesting potential volatility.
- MACD: The Moving Average Convergence Divergence (MACD) has been negative but showing signs of convergence towards the signal line, indicating a possible reversal in the downtrend.
- Conclusion: The trend indicators suggest a potential reversal in the current downtrend.
Momentum Analysis:
- RSI: The Relative Strength Index (RSI) has been fluctuating in the neutral zone, indicating indecision among traders.
- Stochastic Oscillator: Both %K and %D have been rising, reaching overbought levels, suggesting a bullish momentum.
- Conclusion: The momentum indicators point towards a bullish bias in the short term.
Volatility Analysis:
- Bollinger Bands (BB): The Bollinger Bands have been widening, indicating increased volatility in the stock price.
- Conclusion: The volatility indicators suggest heightened price fluctuations in the upcoming sessions.
Volume Analysis:
- On-Balance Volume (OBV): The OBV has been fluctuating, indicating mixed sentiment among investors.
- Chaikin Money Flow (CMF): The CMF has been negative, reflecting selling pressure in the stock.
- Conclusion: The volume indicators suggest uncertainty in the market sentiment.
Overall Conclusion:
Based on the analysis of trend, momentum, volatility, and volume indicators, the stock price of DINO is likely to experience increased volatility in the coming days. The trend indicators hint at a potential reversal in the downtrend, while momentum indicators suggest a bullish bias in the short term. However, the volume indicators reflect mixed sentiment and uncertainty among investors.
Recommendation:
Considering the overall analysis, it is advisable to exercise caution and closely monitor the stock price movement. Traders may consider short-term bullish positions with proper risk management strategies in place. Long-term investors should wait for more clarity in the market sentiment before making significant investment decisions.
Key Takeaways:
- Trend: Potential reversal in the downtrend.
- Momentum: Short-term bullish bias.
- Volatility: Increased price fluctuations expected.
- Volume: Mixed sentiment and uncertainty.
Disclaimer:
This analysis is based on technical indicators and historical data, and market conditions can change rapidly. It is essential to conduct thorough research and consider other factors before making investment decisions. Consulting with a financial advisor is recommended for personalized guidance tailored to individual risk tolerance and investment goals.