Technical Analysis of DLNG 2024-05-10
Overview:
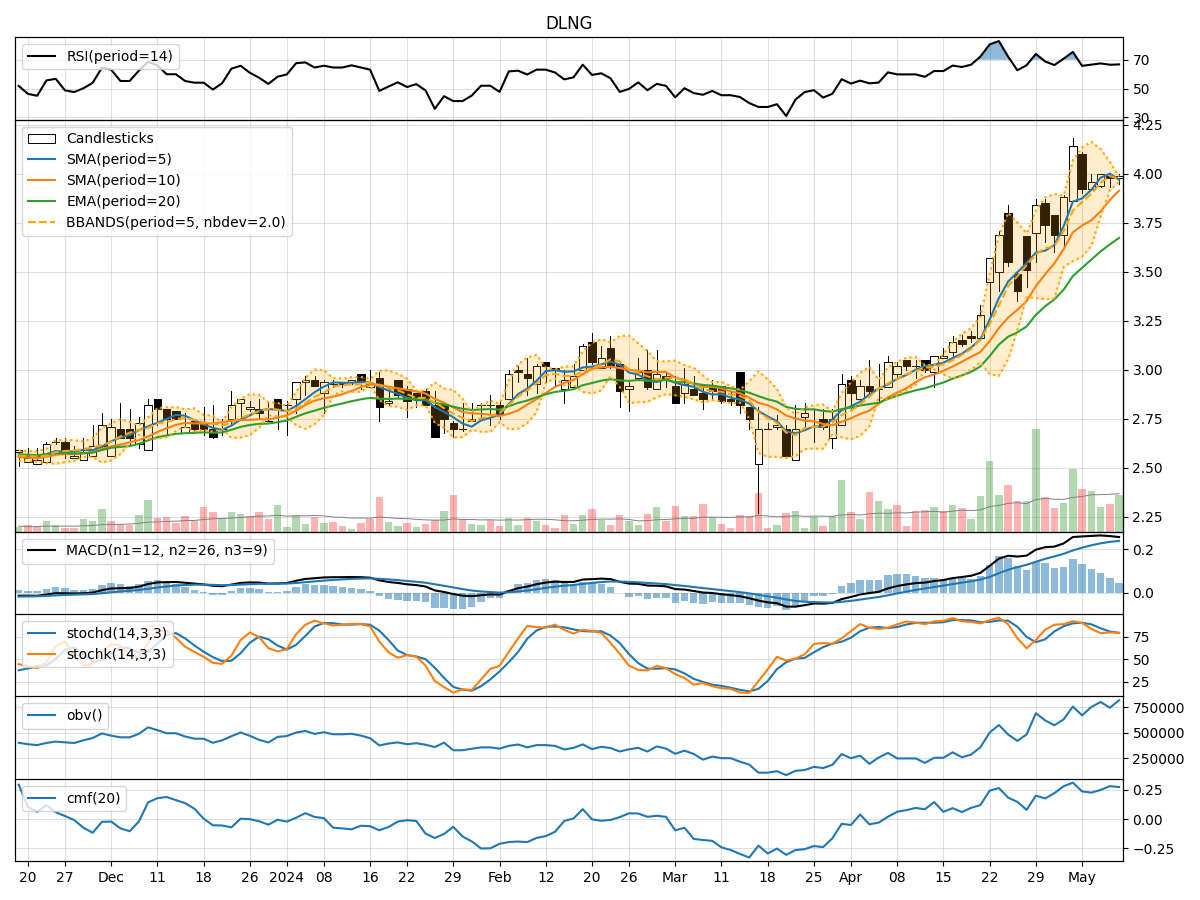
In the last 5 trading days, DLNG stock has shown a consistent uptrend in price, with increasing volumes. The moving averages have been trending upwards, indicating a bullish sentiment. Momentum indicators like RSI and Stochastic oscillators suggest the stock is in overbought territory but still have room for potential upside. Volatility indicators show a narrowing of Bollinger Bands, indicating a possible decrease in volatility. Volume indicators like OBV and CMF show positive accumulation.
Trend Analysis:
- Moving averages (MA) have been steadily increasing, with the 5-day MA consistently above the 10-day SMA, indicating a short-term bullish trend.
- The MACD line has been above the signal line, with both lines trending upwards, suggesting a continuation of the bullish momentum.
- The MACD histogram has been positive, indicating increasing bullish momentum.
Momentum Analysis:
- The RSI has been in the overbought zone, suggesting a potential pullback or consolidation in the near term.
- Stochastic oscillators have been high, indicating that the stock is overbought but can remain in this territory for some time.
- Williams %R is in the oversold region, indicating a potential reversal or consolidation.
Volatility Analysis:
- Bollinger Bands have been narrowing, indicating decreasing volatility and a possible period of consolidation.
- The %B indicator is above 0.5, suggesting the stock is trading above the middle band, indicating a bullish sentiment.
Volume Analysis:
- On-Balance Volume (OBV) has been steadily increasing, indicating strong buying pressure and accumulation of the stock.
- Chaikin Money Flow (CMF) is positive, indicating that money is flowing into the stock.
Conclusion:
Based on the technical indicators and analysis: - Trend: The stock is in a clear upward trend. - Momentum: While momentum indicators suggest the stock is overbought, the overall trend remains bullish. - Volatility: Decreasing volatility and narrowing Bollinger Bands indicate a possible consolidation phase. - Volume: Strong accumulation and positive money flow suggest continued buying interest.
Overall Assessment:
Considering the bullish trend, positive momentum, decreasing volatility, and strong accumulation, the next few days are likely to see the stock price continue its upward movement. Traders should watch for potential profit-taking or consolidation as the stock may be overbought in the short term. Long-term investors can consider holding their positions with a bullish outlook.