Technical Analysis of DNB 2024-05-10
Overview:
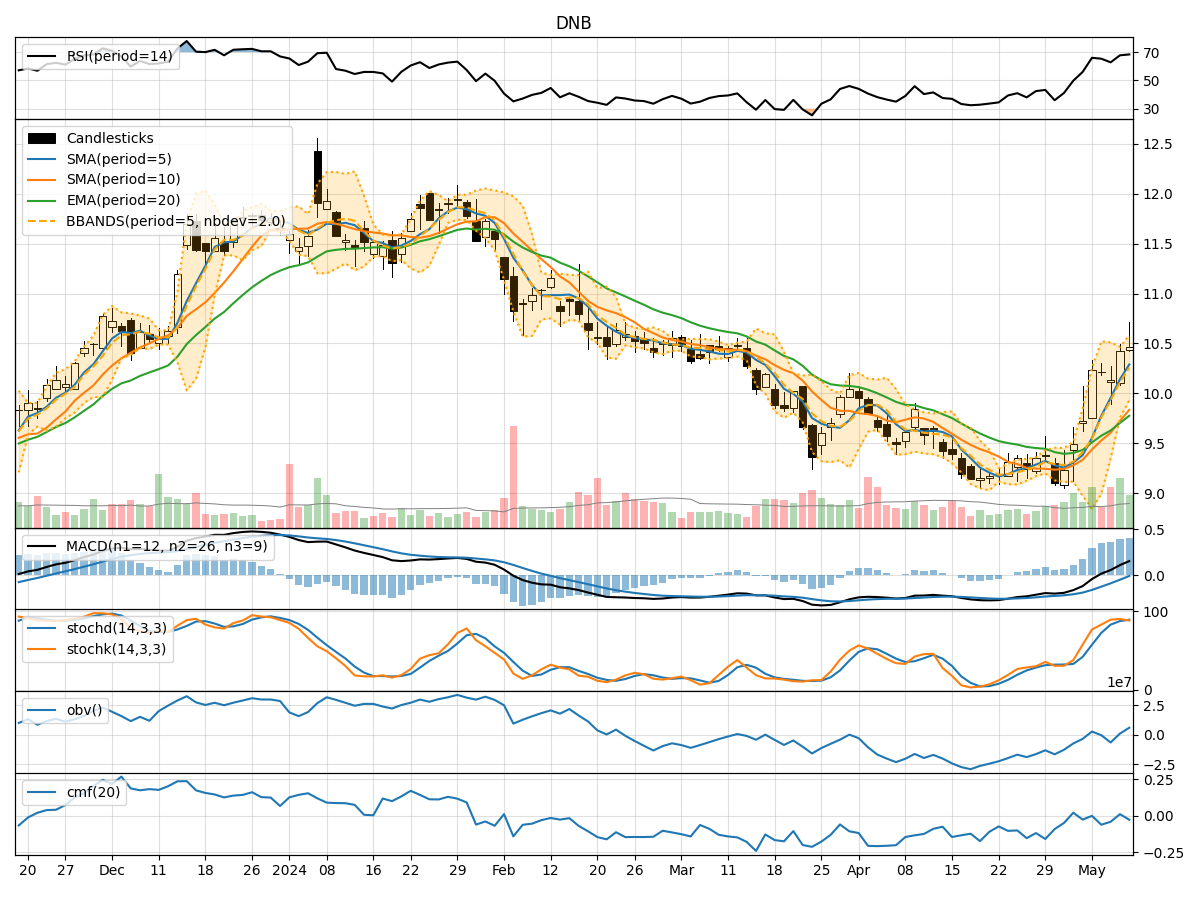
In analyzing the technical indicators for DNB stock over the last 5 days, we will delve into the trend, momentum, volatility, and volume indicators to provide a comprehensive outlook on the possible stock price movement in the coming days. By examining these key indicators, we aim to offer valuable insights and predictions for potential investors.
Trend Indicators:
- Moving Averages (MA): The 5-day moving average has been consistently above the longer-term moving averages (SMA and EMA), indicating a bullish trend.
- MACD: The MACD line has been consistently above the signal line, suggesting a bullish momentum.
- MACD Histogram: The histogram has been increasing, indicating strengthening bullish momentum.
Momentum Indicators:
- RSI: The RSI has been in the overbought territory, suggesting a potential pullback in the stock price.
- Stochastic Oscillator: Both %K and %D have been in the overbought zone, indicating a possible reversal in the stock price.
- Williams %R: The Williams %R is in the oversold region, signaling a potential buying opportunity.
Volatility Indicators:
- Bollinger Bands: The stock price has been trading within the upper Bollinger Band, indicating an overbought condition.
- Bollinger %B: The %B indicator is above 0.8, suggesting a potential reversal or correction in the stock price.
Volume Indicators:
- On-Balance Volume (OBV): The OBV has been declining, indicating selling pressure in the stock.
- Chaikin Money Flow (CMF): The CMF has been negative, suggesting outflow of money from the stock.
Key Observations and Opinions:
- Trend: The stock is in a strong bullish trend based on moving averages and MACD.
- Momentum: Momentum indicators suggest a potential pullback or reversal in the stock price due to overbought conditions.
- Volatility: The stock is currently overbought based on Bollinger Bands, indicating a possible correction.
- Volume: Selling pressure is evident based on declining OBV and negative CMF.
Conclusion:
Based on the analysis of the technical indicators, the stock is likely to experience a short-term pullback or correction in the coming days. Investors should exercise caution and consider waiting for a better entry point before initiating new positions. The overbought conditions and selling pressure indicate a potential downward movement in the stock price. It is advisable to monitor the price action closely and wait for confirmation of a reversal before considering any bullish positions.