Technical Analysis of DPZ 2024-05-10
Overview:
In analyzing the technical indicators for Domino's Pizza Inc. (DPZ) over the last 5 days, we will delve into the trends, momentum, volatility, and volume indicators to provide insights into the possible future stock price movement. By examining these indicators, we aim to offer a comprehensive analysis and make informed predictions for the next few days.
Trend Analysis:
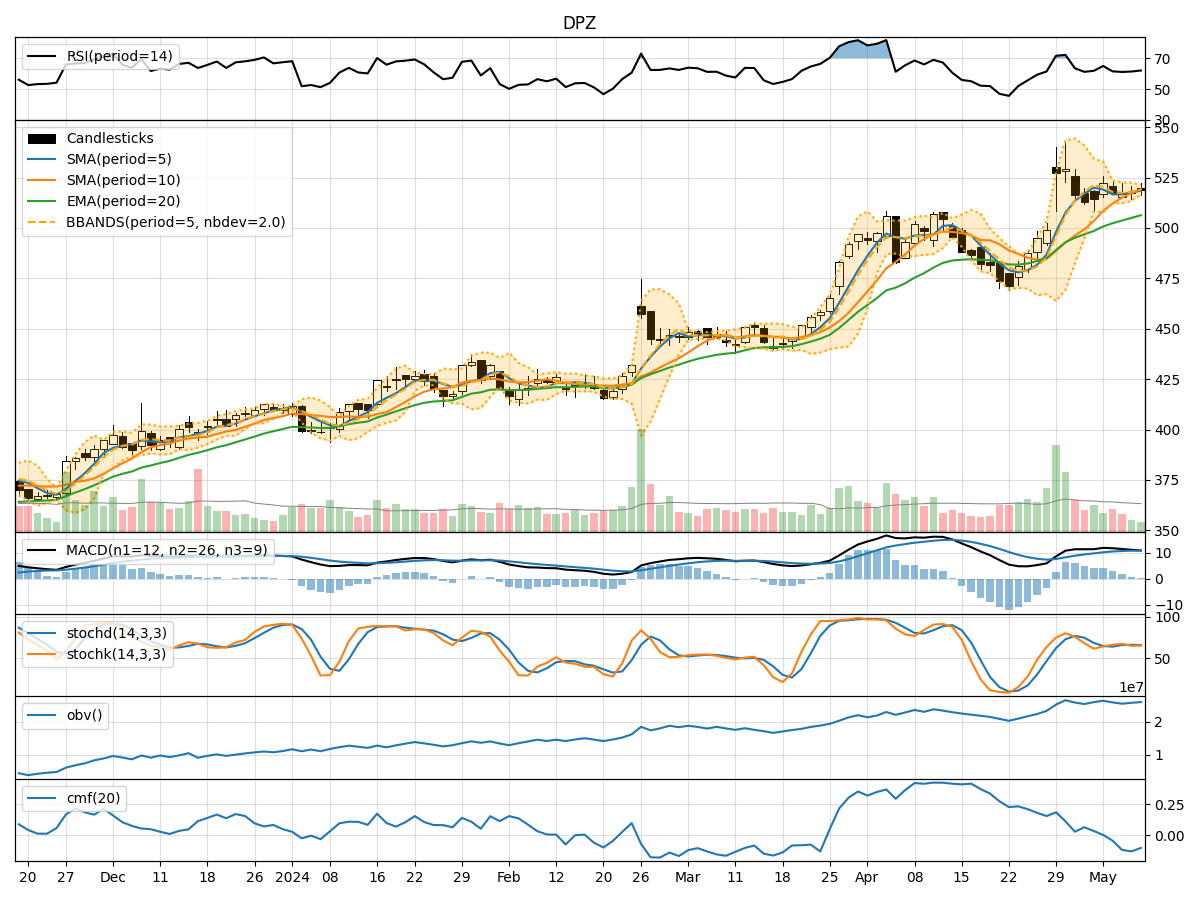
- Moving Averages (MA): The 5-day Moving Average (MA) has been relatively stable around 519, indicating a moderate uptrend.
- MACD: The Moving Average Convergence Divergence (MACD) shows a positive trend with the MACD line consistently above the signal line, suggesting bullish momentum.
- EMA: The Exponential Moving Average (EMA) has been gradually increasing, supporting the bullish sentiment.
Momentum Analysis:
- RSI: The Relative Strength Index (RSI) has been hovering around 60-65, indicating a neutral to slightly bullish momentum.
- Stochastic Oscillator: Both %K and %D lines of the Stochastic Oscillator are in the overbought territory, suggesting a potential reversal or consolidation.
- Williams %R: The Williams %R is also in the oversold region, indicating a possible reversal in the short term.
Volatility Analysis:
- Bollinger Bands (BB): The Bollinger Bands are relatively narrow, indicating low volatility in the stock price.
- BB %B: The %B indicator is around 0.5, suggesting the stock is trading around the middle of the bands.
- BB Width: The narrowing of the Bollinger Bands width indicates a potential breakout or significant price movement ahead.
Volume Analysis:
- On-Balance Volume (OBV): The OBV has been relatively flat, indicating a balance between buying and selling pressure.
- Chaikin Money Flow (CMF): The CMF is negative, suggesting a slight outflow of money from the stock.
Conclusion:
Based on the analysis of the technical indicators, the stock of DPZ is showing signs of consolidation with a slightly bullish bias. The moving averages and MACD support a bullish trend, while momentum indicators like RSI and Stochastic Oscillator suggest a potential reversal or consolidation in the short term. The low volatility indicated by the Bollinger Bands may precede a breakout or significant price movement. The volume indicators show a balance between buying and selling pressure.
Recommendation:
Considering the overall technical analysis, it is advisable to exercise caution in the short term. Traders may consider waiting for a clear breakout above the recent highs for a more definitive bullish signal. Long-term investors can hold their positions with a close eye on key support and resistance levels. It is essential to monitor the price action closely for any confirmation of trend continuation or reversal before making significant trading decisions.