Technical Analysis of DRD 2024-05-10
Overview:
In analyzing the technical indicators for DRD over the last 5 days, we will delve into the trend, momentum, volatility, and volume indicators to provide a comprehensive outlook on the possible stock price movement in the coming days. By examining these key aspects, we aim to offer valuable insights and predictions for potential investors.
Trend Analysis:
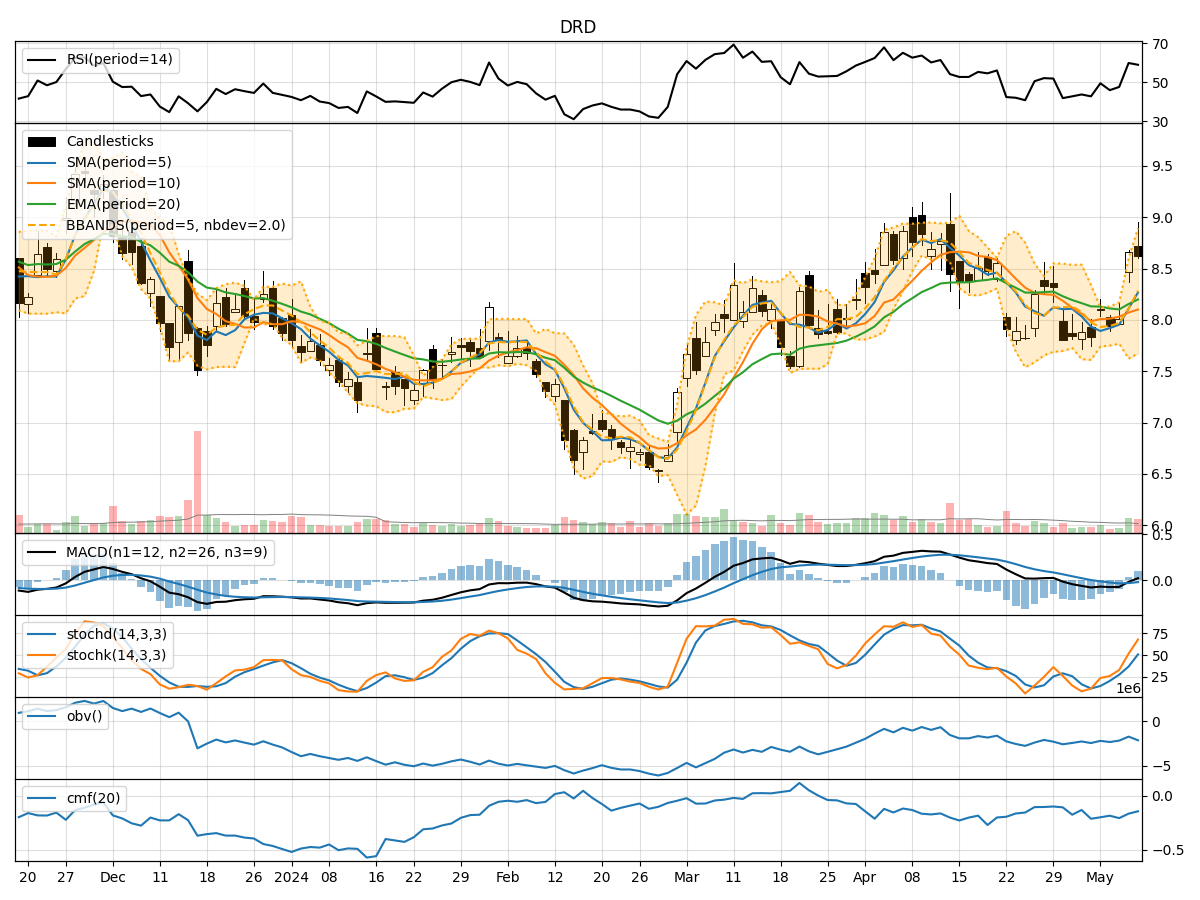
- Moving Averages (MA): The 5-day Moving Average (MA) has been fluctuating around the closing prices, indicating short-term price trends. The Simple Moving Average (SMA) and Exponential Moving Average (EMA) show a slight downward trend, with the EMA lagging behind.
- MACD: The Moving Average Convergence Divergence (MACD) has been negative but is showing signs of convergence towards the signal line, suggesting a possible trend reversal.
- MACD Histogram: The MACD Histogram has been decreasing but is now showing a slight uptick, indicating a potential shift in momentum.
Momentum Analysis:
- RSI: The Relative Strength Index (RSI) has been hovering around the neutral zone, indicating a balanced momentum between buying and selling pressure.
- Stochastic Oscillator: The Stochastic Oscillator shows a recent uptrend, reaching overbought levels, which might signal a potential reversal in the short term.
- Williams %R: The Williams %R indicator suggests an oversold condition, potentially leading to a bullish reversal.
Volatility Analysis:
- Bollinger Bands: The Bollinger Bands are widening, indicating increased volatility in the stock price. The recent price movements have breached the lower band, suggesting a possible oversold condition.
- Bollinger %B: The %B indicator is below 1, indicating that the stock price is trading below the lower Bollinger Band, signaling a potential buying opportunity.
Volume Analysis:
- On-Balance Volume (OBV): The OBV indicator has been fluctuating, showing no clear trend in volume accumulation. This could imply indecision among market participants.
- Chaikin Money Flow (CMF): The CMF is negative, indicating that money is flowing out of the stock. This negative flow might impact the stock price in the short term.
Conclusion:
Based on the analysis of the technical indicators, the stock of DRD is currently exhibiting mixed signals: - Trend: The trend indicators suggest a potential reversal in the short term, with the MACD showing signs of convergence. - Momentum: The momentum indicators are conflicting, with the RSI neutral, Stochastic overbought, and Williams %R oversold. - Volatility: The widening Bollinger Bands and %B below 1 indicate increased volatility and a possible buying opportunity. - Volume: The volume indicators show indecision among market participants, with money flowing out of the stock according to the CMF.
Overall Assessment:
Considering the mixed signals from the technical indicators, the next few days for DRD could be characterized by sideways movement or consolidation. Investors should exercise caution and closely monitor key levels such as the moving averages, MACD convergence, and Bollinger Bands for potential entry or exit points. It is advisable to wait for more clarity in the price action before making significant trading decisions.