Technical Analysis of DRI 2024-05-10
Overview:
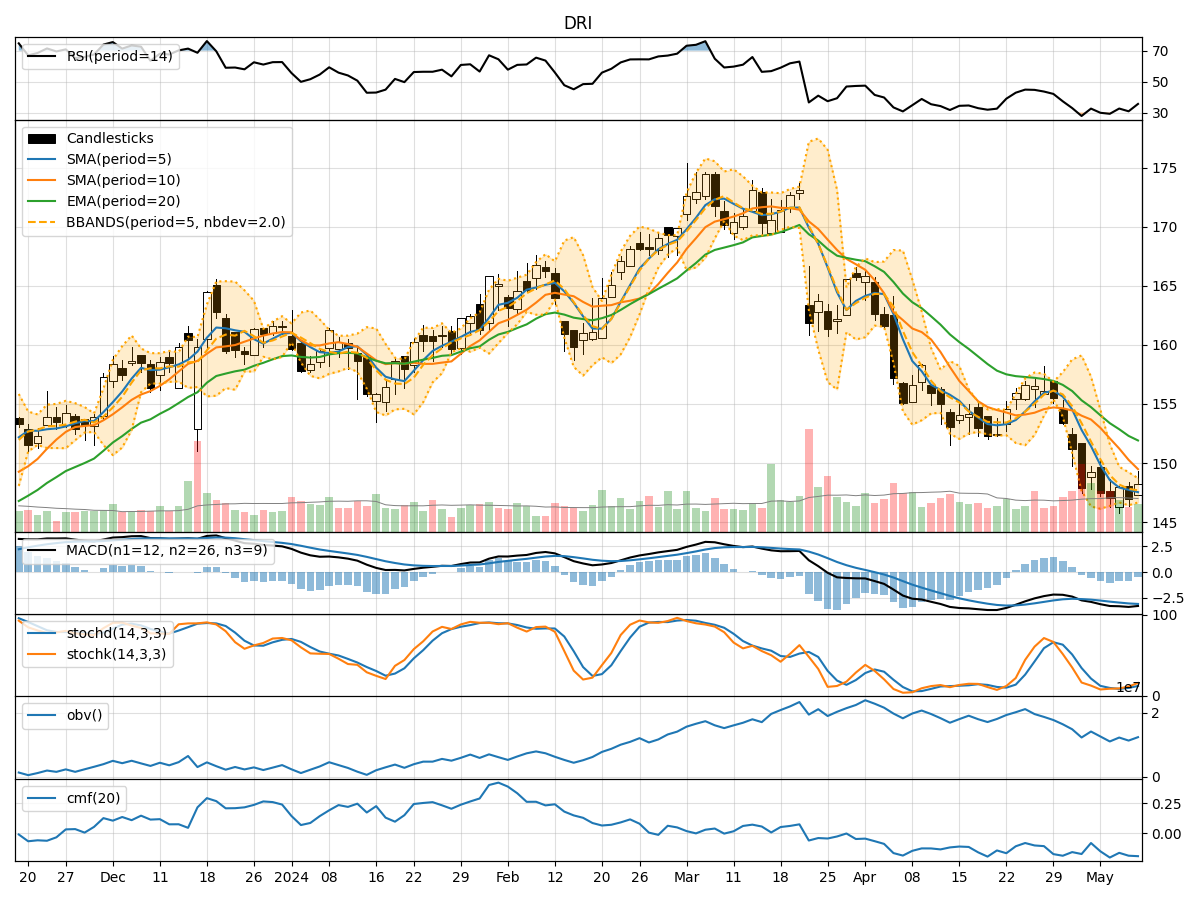
In analyzing the technical indicators for DRI over the last 5 days, we will delve into the trend, momentum, volatility, and volume indicators to provide a comprehensive outlook on the possible stock price movement in the coming days.
Trend Analysis:
- Moving Averages (MA): The 5-day MA has been consistently below the closing prices, indicating a short-term downtrend.
- MACD: The MACD line has been below the signal line, suggesting a bearish momentum.
- EMA: The EMA has been trending downwards, reflecting a weakening trend.
Key Observation: The trend indicators point towards a bearish sentiment in the short term.
Momentum Analysis:
- RSI: The RSI has been below 50, indicating bearish momentum.
- Stochastic Oscillator: Both %K and %D have been trending downwards, signaling a bearish momentum.
- Williams %R: The indicator has been in oversold territory, suggesting a bearish sentiment.
Key Observation: Momentum indicators align with the trend indicators, indicating a bearish momentum.
Volatility Analysis:
- Bollinger Bands (BB): The stock price has been consistently below the upper Bollinger Band, indicating a lack of volatility.
- Bollinger Band %B: The %B has been below 0.5, indicating a lower volatility period.
Key Observation: Volatility indicators suggest a low volatility environment currently.
Volume Analysis:
- On-Balance Volume (OBV): The OBV has been fluctuating, indicating indecision among investors.
- Chaikin Money Flow (CMF): The CMF has been negative, suggesting selling pressure.
Key Observation: Volume indicators reflect a neutral to bearish sentiment among investors.
Conclusion:
Based on the analysis of the technical indicators, the overall outlook for DRI in the next few days is bearish. The trend and momentum indicators both point towards a continued downward movement in the stock price. The low volatility environment suggests a lack of significant price movements in the near term. Additionally, the volume indicators indicate a neutral to bearish sentiment among investors.
Recommendation:
Considering the bearish trend and momentum, investors may consider short-term selling strategies or wait for a more favorable entry point before considering long positions. It is essential to monitor the price action closely and consider risk management strategies to navigate the current market conditions effectively.