Technical Analysis of DTM 2024-05-10
Overview:
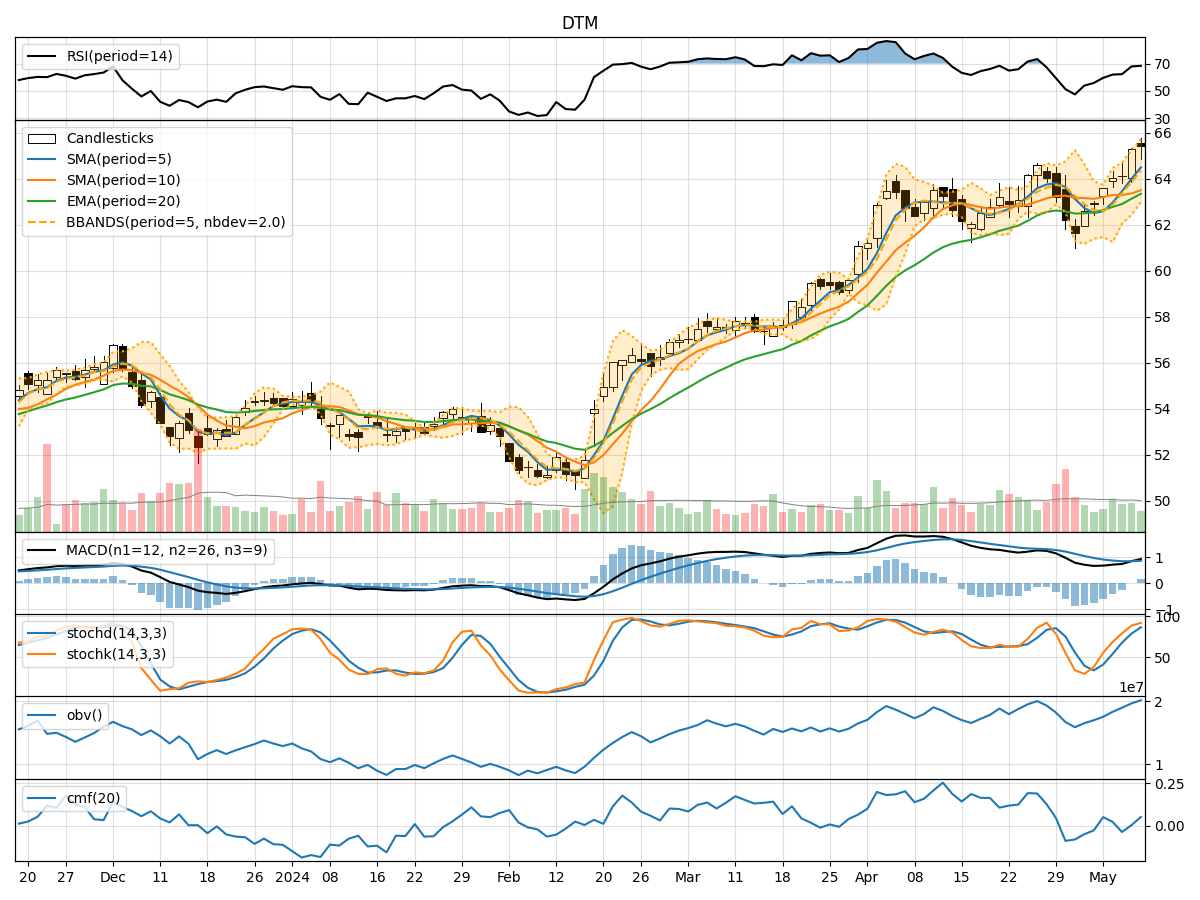
In the last 5 trading days, the stock has shown a consistent uptrend in both price and volume. The moving averages have been trending upwards, indicating a bullish sentiment. Momentum indicators like RSI and Stochastic oscillators are in overbought territory, suggesting a potential reversal or consolidation. Volatility indicators show expanding Bollinger Bands, indicating increased price volatility. Volume indicators have been positive, showing accumulation.
Trend Analysis:
- Moving Averages (MA): The 5-day MA has been consistently above the longer-term SMAs, indicating a strong bullish trend.
- MACD: The MACD line has been above the signal line, indicating bullish momentum.
- MACD Histogram: The histogram has been increasing, showing strengthening bullish momentum.
Momentum Analysis:
- RSI: The RSI is in overbought territory, suggesting a potential pullback or consolidation.
- Stochastic Oscillator: Both %K and %D are in the overbought zone, indicating a possible reversal.
- Williams %R: The indicator is also in the overbought region, signaling a potential reversal.
Volatility Analysis:
- Bollinger Bands: The bands have been expanding, indicating increased price volatility.
- Bollinger %B: The %B is above 0.8, suggesting the stock is overbought.
Volume Analysis:
- On-Balance Volume (OBV): The OBV has been steadily increasing, indicating accumulation.
- Chaikin Money Flow (CMF): The CMF is positive, showing buying pressure.
Key Observations:
- The stock is in a strong uptrend based on moving averages and MACD.
- Momentum indicators suggest the stock is overbought and may experience a pullback.
- Volatility is increasing, indicating potential price swings.
- Volume indicators show accumulation, supporting the bullish trend.
Conclusion:
Based on the technical analysis: - Short-Term: The stock may experience a short-term pullback or consolidation due to overbought conditions indicated by momentum oscillators. - Medium-Long Term: The overall trend remains bullish, supported by moving averages and volume accumulation. - Price Movement: Expect a potential pullback in the next few days followed by a continuation of the uptrend in the medium to long term.
Recommendation:
- Short-Term Traders: Consider taking profits or waiting for a better entry point during the expected pullback.
- Long-Term Investors: Hold onto positions or consider adding to them during the potential pullback for better long-term gains.
Disclaimer:
This analysis is based solely on technical indicators and historical data. Market conditions can change rapidly, and it's essential to monitor the stock closely for any new developments that may impact its price movement.