Technical Analysis of DV 2024-05-10
Overview:
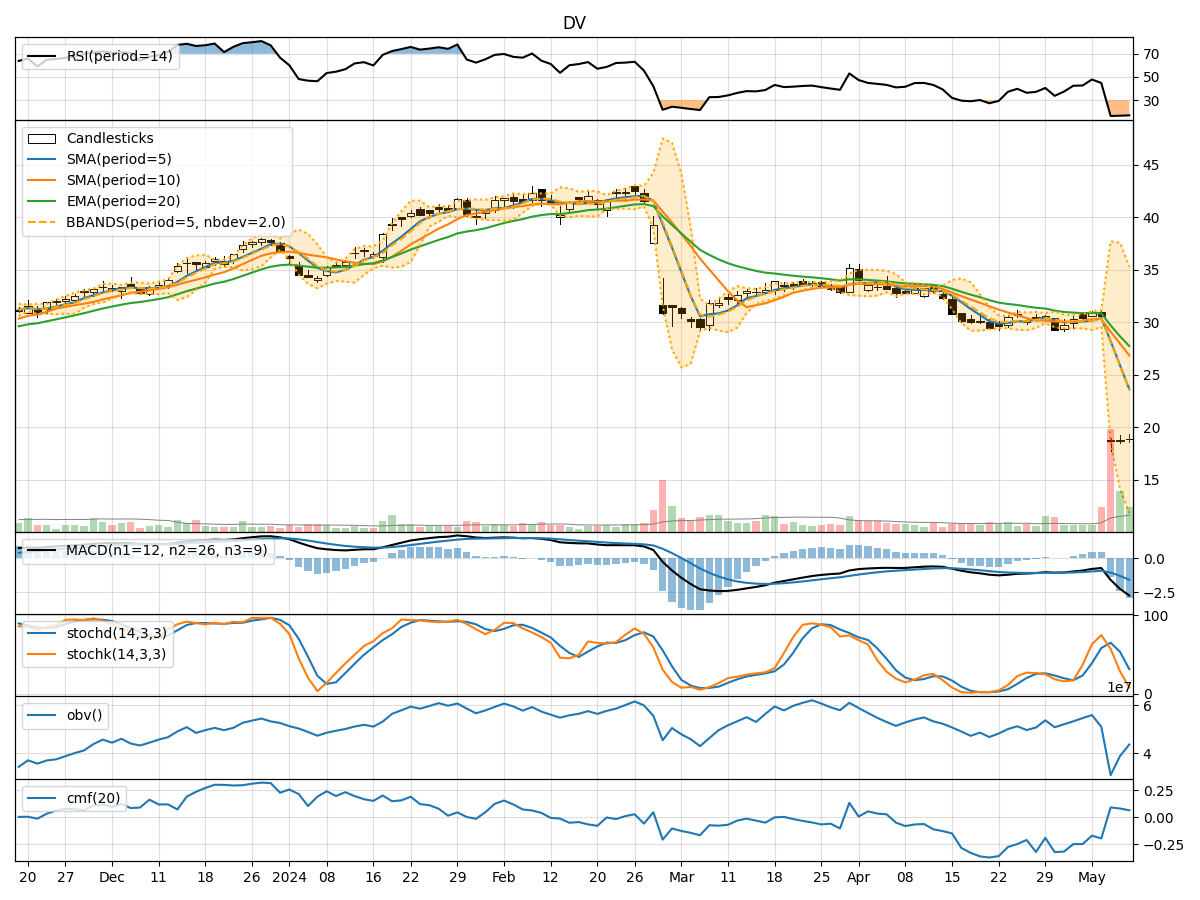
In analyzing the provided Technical Analysis (TA) data for the last 5 days of DV stock, we will delve into various technical indicators across trend, momentum, volatility, and volume categories to derive insights into the possible future stock price movement. By examining key metrics such as moving averages, MACD, RSI, Stochastic Oscillator, Bollinger Bands, and On-Balance Volume (OBV), we aim to provide a comprehensive and insightful analysis to guide potential trading decisions.
Trend Analysis:
- Moving Averages (MA): The 5-day MA has been consistently declining, indicating a bearish trend in the short term.
- MACD: The MACD line has been negative, with the MACD histogram showing a downward trend, signaling bearish momentum.
- EMA: The EMA has also been decreasing, further supporting the bearish sentiment in the stock.
Momentum Analysis:
- RSI: The RSI has been relatively low, indicating oversold conditions and potential for a reversal.
- Stochastic Oscillator: Both %K and %D have been in oversold territory, suggesting a possible upcoming bullish momentum shift.
- Williams %R (WillR): The Williams %R has been deeply oversold, hinting at a potential reversal to the upside.
Volatility Analysis:
- Bollinger Bands (BB): The stock price has breached the lower Bollinger Band, indicating oversold conditions and a potential bounce back.
- BB Percentage (BBP): The BBP is close to 0, suggesting a possible reversal or consolidation in the near future.
Volume Analysis:
- On-Balance Volume (OBV): The OBV has been declining, indicating selling pressure in the stock.
- Chaikin Money Flow (CMF): The CMF has been negative, reflecting a bearish money flow trend.
Conclusion:
Based on the analysis of the technical indicators, the stock of DV is currently in an oversold condition with signs of potential reversal in the near future. The momentum indicators, such as the Stochastic Oscillator and Williams %R, suggest a bullish momentum shift may be on the horizon. Additionally, the breach of the lower Bollinger Band and the low RSI point towards a possible price bounce or consolidation.
Considering the overall technical picture, it is likely that DV stock may experience a short-term bullish reversal or sideways movement in the next few trading days. Traders and investors should closely monitor the price action and key technical levels for confirmation of the anticipated trend change.
Always remember to combine technical analysis with other forms of analysis and risk management strategies to make well-informed trading decisions.