Technical Analysis of DVA 2024-05-10
Overview:
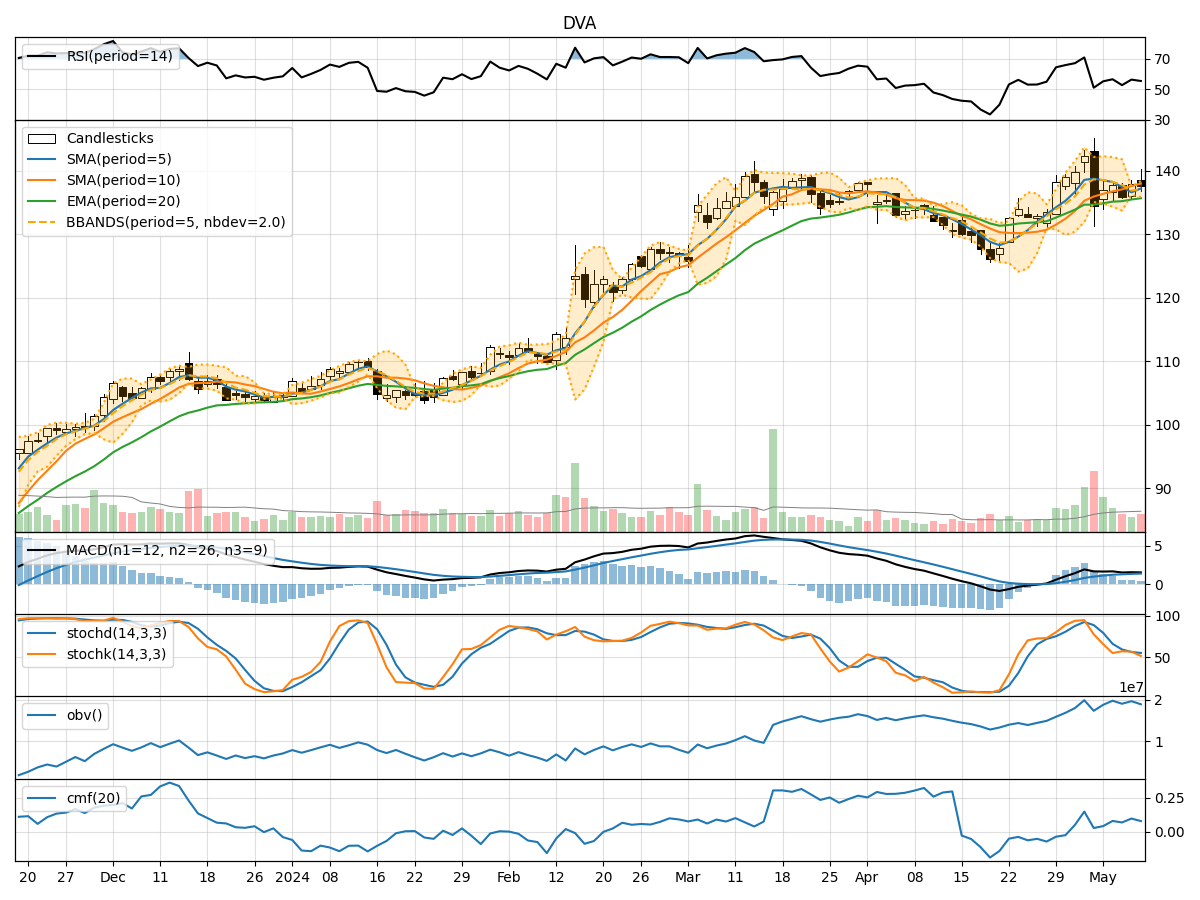
In analyzing the technical indicators for DaVita Inc. (DVA) over the last 5 days, we will delve into the trends, momentum, volatility, and volume indicators to provide insights into the possible future stock price movements. By examining these indicators, we aim to offer a comprehensive analysis and make informed predictions for the upcoming days.
Trend Indicators:
- Moving Averages (MA): The 5-day MA has been gradually decreasing, indicating a short-term downtrend in the stock price.
- MACD (Moving Average Convergence Divergence): The MACD line has been hovering around the signal line, suggesting a lack of strong momentum in either direction.
- EMA (Exponential Moving Average): The EMA has been relatively stable, showing a slower response to recent price changes.
Key Observation: The trend indicators suggest a neutral to slightly bearish sentiment in the short term.
Momentum Indicators:
- RSI (Relative Strength Index): RSI values have been fluctuating around the mid-level, indicating a balanced momentum between buying and selling pressure.
- Stochastic Oscillator: Both %K and %D values have been oscillating within a range, reflecting indecision in the market.
- Williams %R (Willams Percent Range): The indicator has been in the oversold territory, suggesting a potential reversal in the stock price.
Key Observation: Momentum indicators signal a lack of clear direction, with a slight inclination towards a potential bullish reversal.
Volatility Indicators:
- Bollinger Bands (BB): The bands have been narrowing, indicating decreasing volatility in the stock price.
- Bollinger %B (BBP): %B values have been relatively low, suggesting the stock is trading closer to the lower band.
- Average True Range (ATR): ATR values have been decreasing, indicating a decline in price volatility.
Key Observation: Volatility indicators point towards a period of consolidation or a potential breakout in the near future.
Volume Indicators:
- On-Balance Volume (OBV): The OBV has shown mixed movements, reflecting uncertainty in the buying and selling pressure.
- Chaikin Money Flow (CMF): CMF values have been positive but relatively flat, indicating a balance between accumulation and distribution.
Key Observation: Volume indicators suggest a lack of strong conviction from market participants.
Conclusion:
Based on the analysis of the technical indicators, the next few days for DVA stock price could see sideways movement with a slight bullish bias. The trend indicators point towards a neutral to slightly bearish outlook, while momentum indicators hint at a potential bullish reversal. Volatility indicators suggest a period of consolidation, and volume indicators indicate mixed market sentiment.
Overall, the stock is likely to trade within a range with a potential upside bias in the coming days. Traders should closely monitor key support and resistance levels for potential entry and exit points.