Technical Analysis of EBR.B 2024-05-10
Overview:
In analyzing the technical indicators for EBR.B over the last 5 days, we will delve into the trend, momentum, volatility, and volume indicators to provide a comprehensive outlook on the possible stock price movement in the coming days. By examining these key aspects, we aim to offer valuable insights and predictions to guide investment decisions.
Trend Analysis:
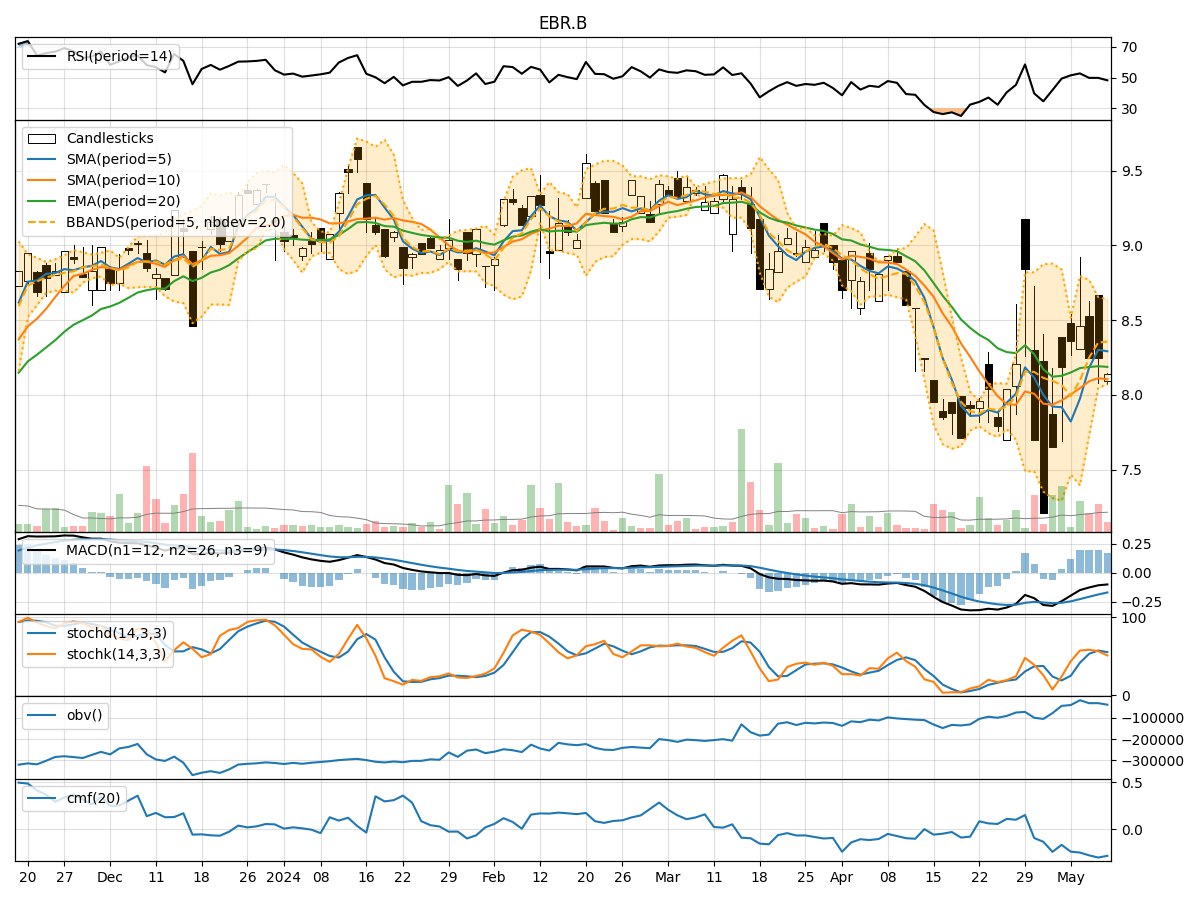
- Moving Averages (MA): The 5-day Moving Average (MA) has been consistently above the Simple Moving Average (SMA) and Exponential Moving Average (EMA), indicating a short-term bullish trend.
- MACD: The MACD line has been below the signal line, suggesting a bearish momentum in the stock price.
- MACD Histogram: The MACD Histogram has been positive, indicating a potential bullish momentum.
Momentum Analysis:
- RSI: The Relative Strength Index (RSI) has been fluctuating around the 50 level, indicating a neutral momentum in the stock.
- Stochastic Oscillator: The Stochastic Oscillator shows mixed signals, with the %K line crossing the %D line, suggesting a potential reversal in momentum.
- Williams %R: The Williams %R is in the oversold territory, indicating a possible buying opportunity.
Volatility Analysis:
- Bollinger Bands: The Bollinger Bands have been narrowing, suggesting a decrease in volatility and a potential consolidation phase.
- Bollinger %B: The %B indicator is hovering around the middle band, indicating a balanced market sentiment.
Volume Analysis:
- On-Balance Volume (OBV): The OBV indicator has been relatively flat, indicating a lack of significant buying or selling pressure.
- Chaikin Money Flow (CMF): The CMF is negative, suggesting a bearish money flow in the stock.
Conclusion:
Based on the analysis of the technical indicators, the stock of EBR.B is currently in a sideways consolidation phase with mixed signals across different indicators. The moving averages suggest a short-term bullish trend, while the MACD indicates a bearish momentum. The volatility is decreasing, indicating a potential stabilization in price movements. However, the volume indicators show a lack of significant buying pressure.
Forecast:
Given the current market dynamics and the conflicting signals from the technical indicators, it is likely that EBR.B will continue to trade in a sideways range in the next few days. Traders should exercise caution and wait for clearer signals before taking any significant positions. It is advisable to closely monitor the price action and key support/resistance levels for potential breakout opportunities.
In conclusion, the stock is currently in a consolidation phase, and a decisive move in either direction will depend on the resolution of the conflicting signals from the technical indicators. Investors should remain vigilant and adapt their strategies accordingly to navigate the uncertain market conditions.