Technical Analysis of EC 2024-05-10
Overview:
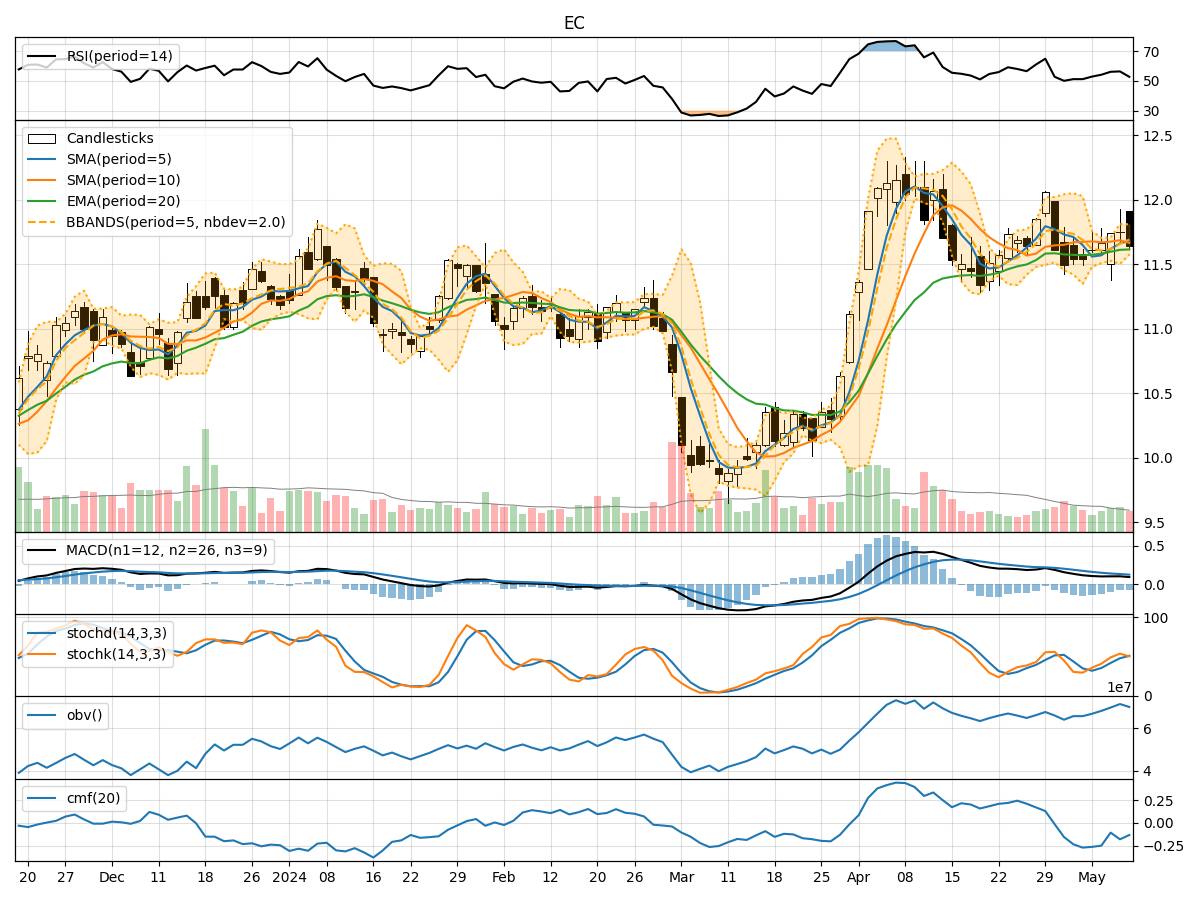
In the last 5 trading days, EC stock has shown mixed signals across various technical indicators. The stock price has fluctuated within a narrow range, with some indicators suggesting potential bullish momentum while others indicating a possible consolidation phase. By analyzing trend, momentum, volatility, and volume indicators, we can gain a comprehensive understanding of the stock's potential future price movement.
Trend Analysis:
- Moving Averages (MA): The 5-day Moving Average (MA) has been fluctuating around the closing prices, indicating a lack of clear trend direction.
- MACD: The MACD line has been hovering around the signal line, suggesting a balanced momentum in the short term.
- EMA: The Exponential Moving Average (EMA) has shown a slight upward trend, indicating a potential bullish sentiment.
Momentum Analysis:
- RSI: The Relative Strength Index (RSI) has been oscillating around the 50 level, indicating a neutral momentum.
- Stochastic Oscillator: Both %K and %D have been fluctuating, showing indecision in momentum.
- Williams %R: The Williams %R is in oversold territory, suggesting a possible buying opportunity.
Volatility Analysis:
- Bollinger Bands: The Bollinger Bands have shown narrowing volatility, indicating a potential decrease in price fluctuations.
- Bollinger %B: The %B indicator is below 1, suggesting the stock is trading below the lower band.
Volume Analysis:
- On-Balance Volume (OBV): The OBV has shown mixed signals, indicating no clear accumulation or distribution pattern.
- Chaikin Money Flow (CMF): The CMF has been negative, suggesting a lack of buying pressure.
Key Observations:
- The stock is currently in a consolidation phase with mixed signals from various indicators.
- The trend indicators show a potential bullish sentiment in the short term.
- Momentum indicators suggest a neutral stance with a slight bias towards buying.
- Volatility indicators point towards decreasing price fluctuations.
- Volume indicators indicate a lack of significant buying pressure.
Conclusion:
Based on the analysis of technical indicators, the next few days' possible stock price movement for EC is sideways consolidation with a slight bullish bias. Traders may consider monitoring key support and resistance levels for potential entry and exit points. It is advisable to wait for more definitive signals from the indicators before making significant trading decisions.