Technical Analysis of EGP 2024-05-10
Overview:
In analyzing the technical indicators for EGP stock over the last 5 days, we will delve into the trend, momentum, volatility, and volume indicators to provide a comprehensive outlook on the possible stock price movement in the coming days.
Trend Analysis:
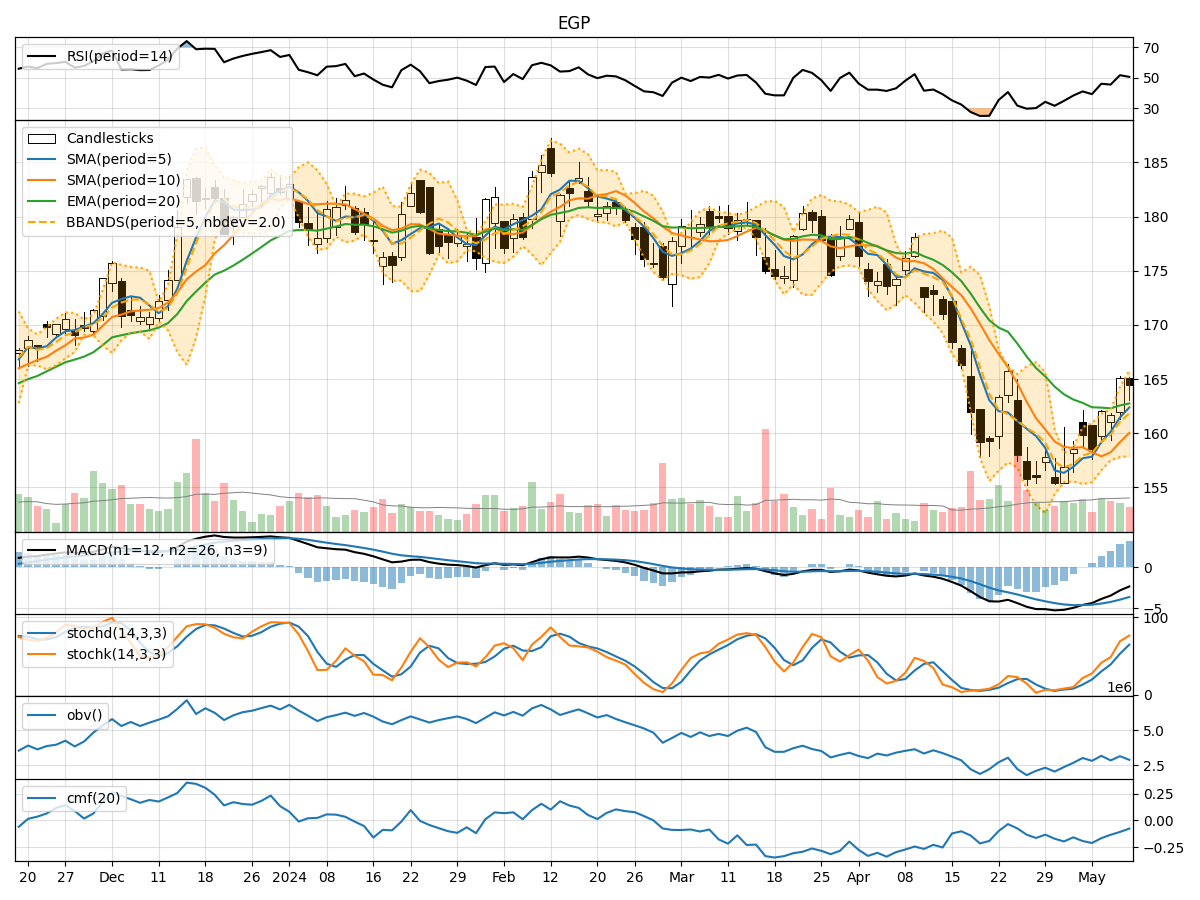
- Moving Averages (MA): The 5-day Moving Average (MA) has been consistently above the Simple Moving Average (SMA) and Exponential Moving Average (EMA) over the past 5 days, indicating a short-term bullish trend.
- MACD: The MACD line has been consistently above the signal line, with the MACD Histogram showing an increasing positive trend, suggesting bullish momentum.
Momentum Analysis:
- RSI: The Relative Strength Index (RSI) has been gradually increasing and is currently above 50, indicating strengthening bullish momentum.
- Stochastic Oscillator: Both %K and %D lines of the Stochastic Oscillator are in the overbought zone, suggesting a potential reversal or consolidation in the near term.
Volatility Analysis:
- Bollinger Bands (BB): The stock price has been trading within the Bollinger Bands, with the bands widening slightly, indicating increased volatility.
- Bollinger %B (BBP): The %B indicator is below 1, suggesting that the stock price is trading below the lower Bollinger Band, potentially indicating an oversold condition.
Volume Analysis:
- On-Balance Volume (OBV): The OBV has been fluctuating but generally trending downwards, indicating some selling pressure in the stock.
- Chaikin Money Flow (CMF): The CMF has been negative over the past 5 days, indicating that money is flowing out of the stock.
Conclusion:
Based on the analysis of the technical indicators: - Trend: The stock is in a short-term bullish trend. - Momentum: The momentum is bullish but showing signs of potential reversal due to overbought conditions. - Volatility: Volatility has increased, potentially leading to larger price swings. - Volume: The volume indicators suggest some selling pressure in the stock.
Forecast:
Given the overall bullish trend and momentum, the stock price of EGP is likely to continue its upward movement in the near term. However, caution is advised due to the overbought conditions indicated by the Stochastic Oscillator. Traders should closely monitor the price action and consider taking profits or implementing risk management strategies to navigate potential reversals or consolidations.
Key Takeaways:
- Upward Bias: The stock is currently in an upward trend.
- Caution Advised: Watch for potential reversals due to overbought conditions.
- Risk Management: Implement proper risk management strategies to protect gains.
Recommendation:
Bullish View: Considering the overall bullish sentiment, investors may look for buying opportunities on pullbacks or consolidations, with a keen eye on managing risks effectively.
Remember, market dynamics can change rapidly, so it's essential to stay updated on the latest developments and adjust your strategy accordingly.