Technical Analysis of EIX 2024-05-10
Overview:
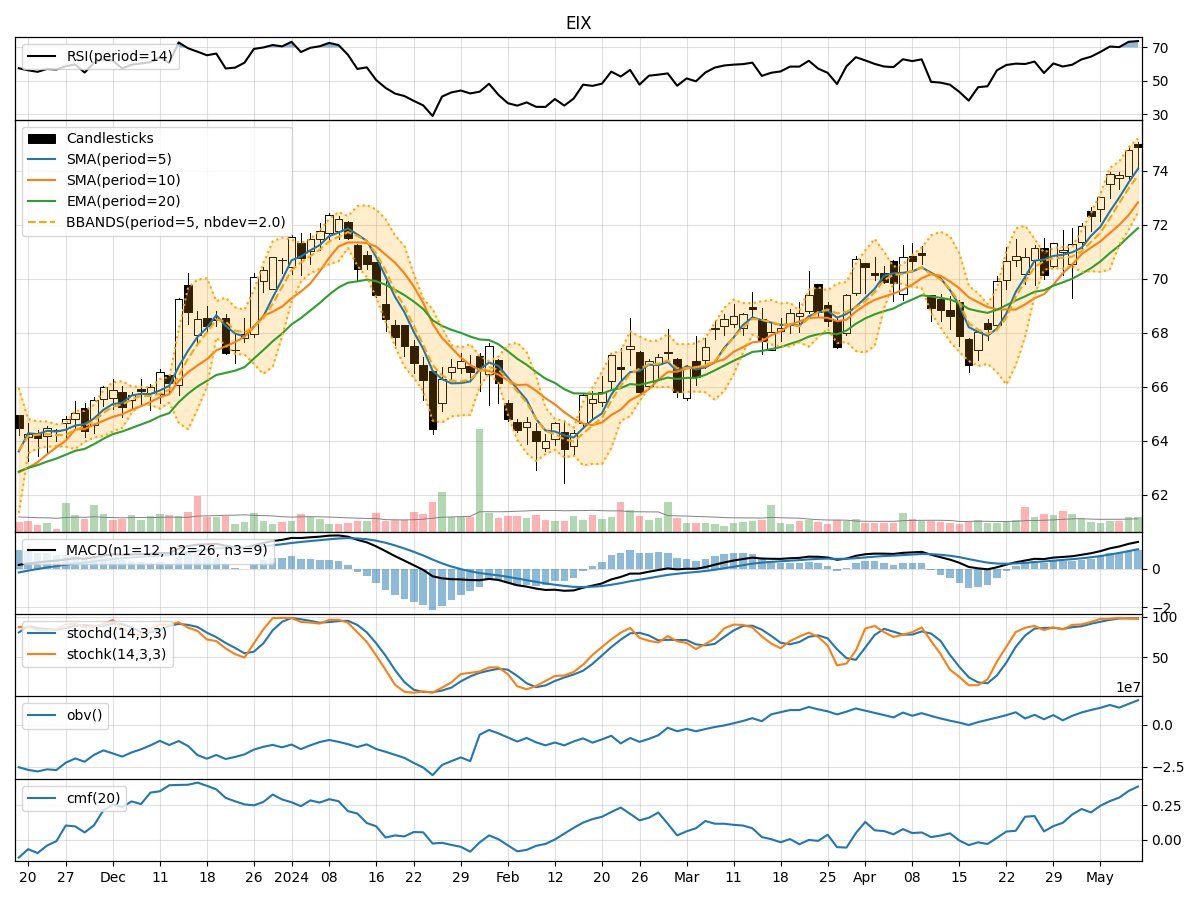
In analyzing the technical indicators for EIX over the last 5 days, we will delve into the trend, momentum, volatility, and volume indicators to provide a comprehensive outlook on the possible stock price movement in the coming days.
Trend Analysis:
- Moving Averages (MA): The 5-day Moving Average has been consistently rising, indicating a bullish trend in the short term.
- MACD: The MACD line has been increasing, crossing above the signal line, suggesting a bullish momentum.
- EMA: The Exponential Moving Average has been trending upwards, supporting the bullish sentiment.
Momentum Analysis:
- RSI: The Relative Strength Index has been increasing, showing strengthening buying momentum.
- Stochastic Oscillator: Both %K and %D have been high, indicating an overbought condition.
- Williams %R: The indicator is in the oversold territory, suggesting a potential reversal.
Volatility Analysis:
- Bollinger Bands: The stock price has been trading near the upper Bollinger Band, indicating high volatility.
- Bollinger %B: The %B value is above 0.8, signifying a potential overbought condition.
Volume Analysis:
- On-Balance Volume (OBV): The OBV has been steadily increasing, reflecting strong buying pressure.
- Chaikin Money Flow (CMF): The CMF is positive, indicating money flow into the stock.
Key Observations:
- The trend indicators suggest a bullish sentiment in the short term.
- Momentum indicators show a mix of overbought and oversold conditions, hinting at a possible correction.
- Volatility remains high, indicating potential price swings.
- Volume indicators support the bullish trend with increasing buying pressure.
Conclusion:
Based on the analysis of technical indicators, the stock price of EIX is likely to experience further upward movement in the coming days. However, given the overbought conditions in some momentum indicators and high volatility, a short-term correction or consolidation may occur before the uptrend resumes. Traders should closely monitor key support and resistance levels for potential entry or exit points.