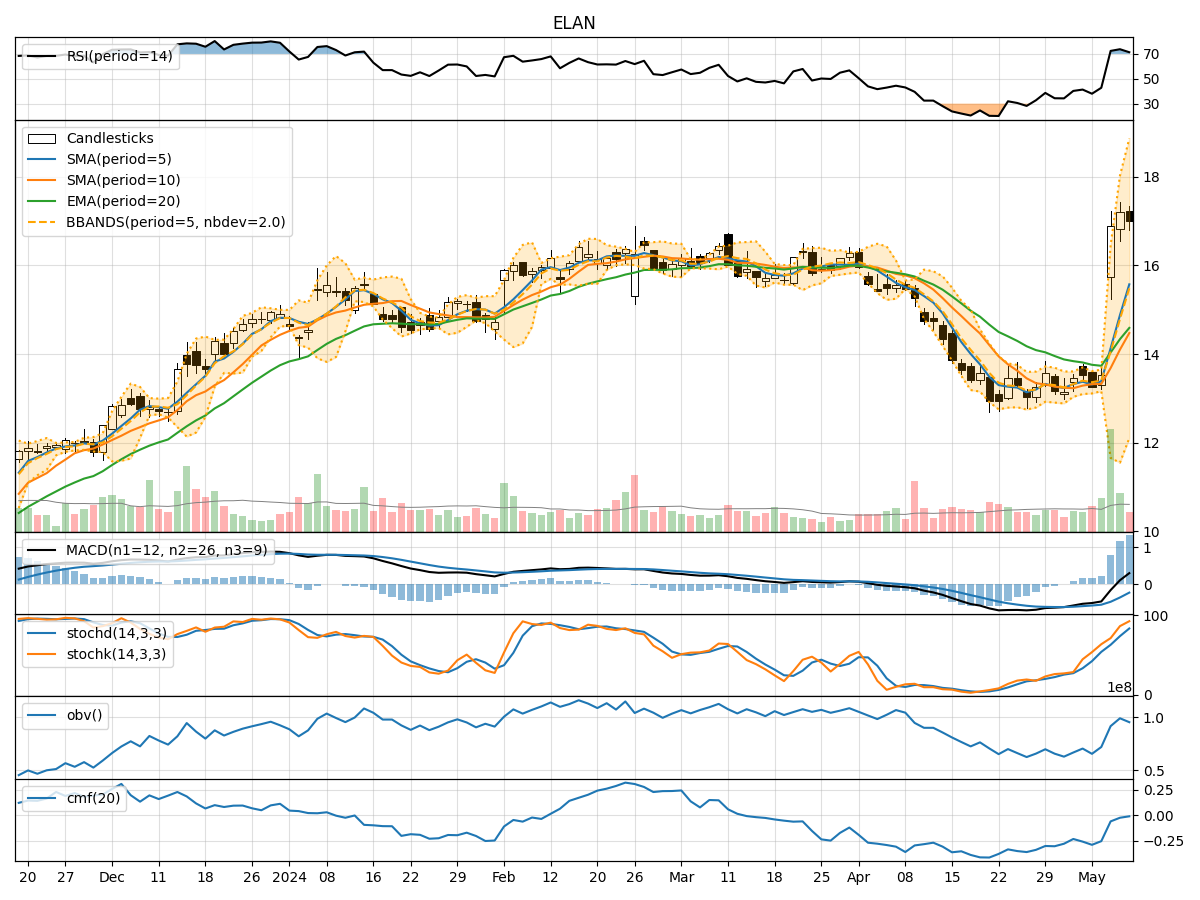
Technical Analysis of ELAN 2024-05-10
Overview:
In analyzing the technical indicators for ELAN over the last 5 days, we will delve into the trend, momentum, volatility, and volume indicators to provide a comprehensive outlook on the possible stock price movement in the coming days. By examining these key aspects, we aim to offer valuable insights and predictions for potential investors.
Trend Analysis:
- Moving Averages (MA): The 5-day Moving Average (MA) has been showing an upward trend, indicating a positive momentum in the stock price.
- MACD: The Moving Average Convergence Divergence (MACD) has been consistently increasing, suggesting a strengthening bullish trend.
- EMA: The Exponential Moving Average (EMA) has been on the rise, supporting the bullish sentiment in the short to medium term.
Momentum Analysis:
- RSI: The Relative Strength Index (RSI) has been trending upwards, indicating increasing buying pressure and potential overbought conditions.
- Stochastic Oscillator: Both %K and %D values have been in the overbought territory, signaling a strong bullish momentum.
- Williams %R: The Williams %R is also in the oversold region, suggesting a potential reversal or correction in the near future.
Volatility Analysis:
- Bollinger Bands: The Bollinger Bands have been widening, indicating increased volatility in the stock price.
- Bollinger %B: The %B value has been fluctuating, suggesting potential price reversals or breakouts in the coming days.
Volume Analysis:
- On-Balance Volume (OBV): The OBV has been fluctuating, indicating mixed buying and selling pressure in the stock.
- Chaikin Money Flow (CMF): The CMF has been negative, suggesting a lack of strong buying interest in the stock.
Key Observations:
- The trend indicators suggest a strong bullish sentiment in the stock price.
- Momentum indicators point towards potential overbought conditions, signaling a need for caution.
- Volatility indicators indicate increased price fluctuations and potential trading opportunities.
- Volume indicators show mixed signals, reflecting uncertainty in market participation.
Conclusion:
Based on the analysis of the technical indicators, the stock price of ELAN is likely to continue its upward trajectory in the short term. However, caution is advised due to the overbought conditions indicated by the momentum indicators. Traders should closely monitor price movements for potential reversals or corrections. Overall, the outlook for ELAN remains bullish in the near future, but a consolidation phase or minor pullback may be expected before further upside potential.