Technical Analysis of ENLC 2024-05-10
Overview:
In analyzing the technical indicators for ENLC over the last 5 days, we will delve into the trend, momentum, volatility, and volume indicators to provide a comprehensive outlook on the possible stock price movement in the coming days. By examining these key aspects, we aim to offer valuable insights and predictions for potential investors.
Trend Analysis:
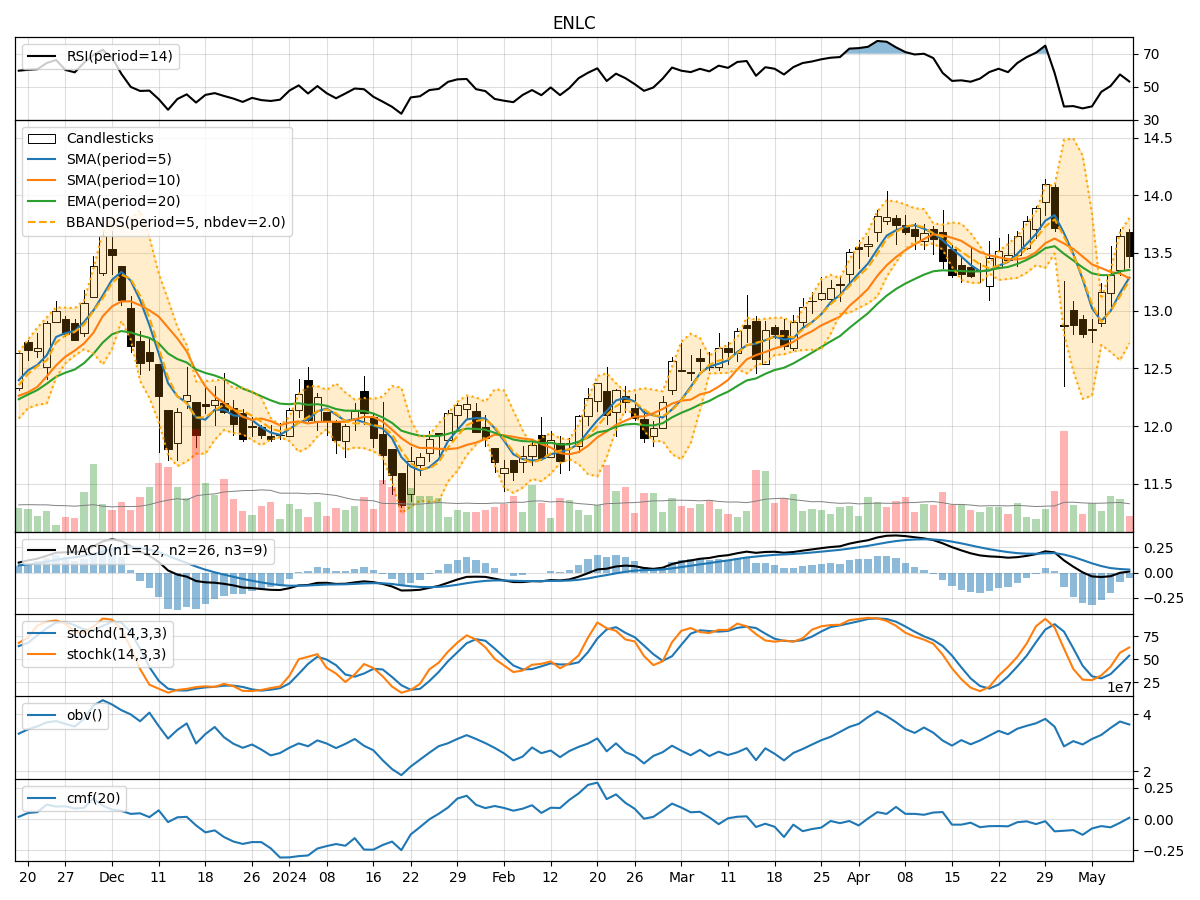
- Moving Averages (MA): The 5-day Moving Average (MA) has been fluctuating around the closing prices, indicating short-term price trends. The Simple Moving Average (SMA) and Exponential Moving Average (EMA) show a slight downward trend, with the EMA slightly below the SMA.
- MACD: The Moving Average Convergence Divergence (MACD) has been negative, suggesting a bearish momentum in the short term. The MACD Histogram (MACDH) has been decreasing, indicating weakening bearish momentum.
Momentum Analysis:
- RSI: The Relative Strength Index (RSI) has been fluctuating but is currently in the neutral zone, suggesting a balanced momentum between buying and selling pressure.
- Stochastic Oscillator: Both %K and %D of the Stochastic Oscillator have been rising, indicating increasing buying pressure. However, they are approaching overbought levels, signaling a potential reversal.
- Williams %R: The Williams %R is in the oversold region, indicating a possible buying opportunity.
Volatility Analysis:
- Bollinger Bands (BB): The Bollinger Bands have been narrowing, suggesting decreasing volatility. The bands are relatively close to the moving average, indicating a period of consolidation.
Volume Analysis:
- On-Balance Volume (OBV): The OBV has been fluctuating but is showing a slight increase, indicating a potential accumulation phase.
- Chaikin Money Flow (CMF): The CMF has been negative, suggesting a slight outflow of money from the stock. However, the recent uptick indicates a potential reversal.
Conclusion:
Based on the analysis of the technical indicators, the next few days for ENLC could see sideways movement with a slight bullish bias. The trend indicators suggest a consolidation phase with a slightly bearish bias, while the momentum indicators show a mix of buying and selling pressure. Volatility is decreasing, indicating a period of stability, and volume indicators point towards a potential accumulation phase.
Investors should closely monitor the Stochastic Oscillator for potential overbought conditions and the RSI for any signs of divergence. Additionally, keeping an eye on the OBV and CMF for confirmation of buying interest would be prudent. Overall, a cautious approach with a focus on key support and resistance levels is recommended in the current market environment.