Technical Analysis of EQT 2024-05-10
Overview:
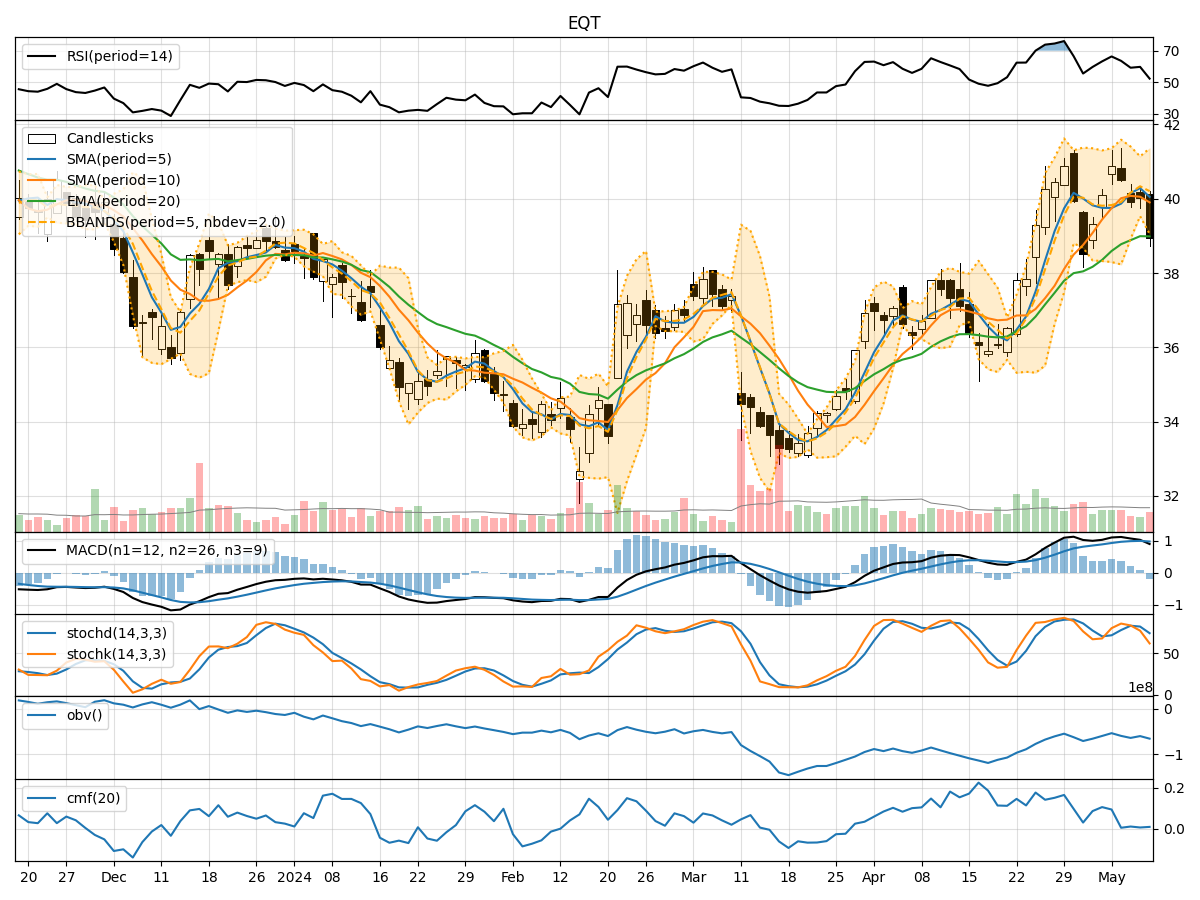
In analyzing the technical indicators for EQT over the last 5 days, we will delve into the trend, momentum, volatility, and volume indicators to provide a comprehensive assessment of the stock's potential price movement. By examining these key factors, we aim to offer valuable insights and predictions for the next few days.
Trend Analysis:
- Moving Averages (MA): The 5-day Moving Average (MA) has been fluctuating around the 39.75 to 40.15 range, indicating a relatively stable trend.
- MACD: The Moving Average Convergence Divergence (MACD) has shown a slight decrease in the MACD line compared to the Signal line, suggesting a potential weakening of the bullish momentum.
- EMA: The Exponential Moving Average (EMA) has been gradually increasing, reflecting a positive trend in the stock price.
Momentum Analysis:
- RSI: The Relative Strength Index (RSI) has been oscillating around 50, indicating a neutral momentum in the stock.
- Stochastic Oscillator: The Stochastic Oscillator shows a decline in both %K and %D values, signaling a potential bearish momentum shift.
- Williams %R: The Williams %R indicator is in oversold territory, suggesting a possible reversal in the stock price.
Volatility Analysis:
- Bollinger Bands: The Bollinger Bands have shown narrowing volatility, with the stock price approaching the lower band, indicating a potential consolidation phase.
- Bollinger %B: The %B indicator is close to 0, suggesting the stock is oversold and may experience a reversal in the near term.
Volume Analysis:
- On-Balance Volume (OBV): The OBV has been negative, indicating selling pressure in the stock.
- Chaikin Money Flow (CMF): The CMF has been relatively low, suggesting a lack of buying interest in the stock.
Key Observations:
- The trend indicators show a mixed picture, with the EMA indicating a positive trend while the MACD suggests a potential weakening of bullish momentum.
- Momentum indicators point towards a neutral to bearish sentiment, with the Stochastic Oscillator and Williams %R indicating oversold conditions.
- Volatility indicators suggest a potential consolidation phase, with Bollinger Bands narrowing.
- Volume indicators reflect selling pressure and a lack of significant buying interest in the stock.
Conclusion:
Based on the analysis of the technical indicators, the next few days for EQT stock price movement could be sideways to slightly bearish. The mixed signals from trend and momentum indicators, coupled with narrowing volatility and negative volume indicators, indicate a potential period of consolidation or a mild downward trend. Traders should exercise caution and closely monitor key support levels for potential entry or exit points.