Technical Analysis of ERF 2024-05-10
Overview:
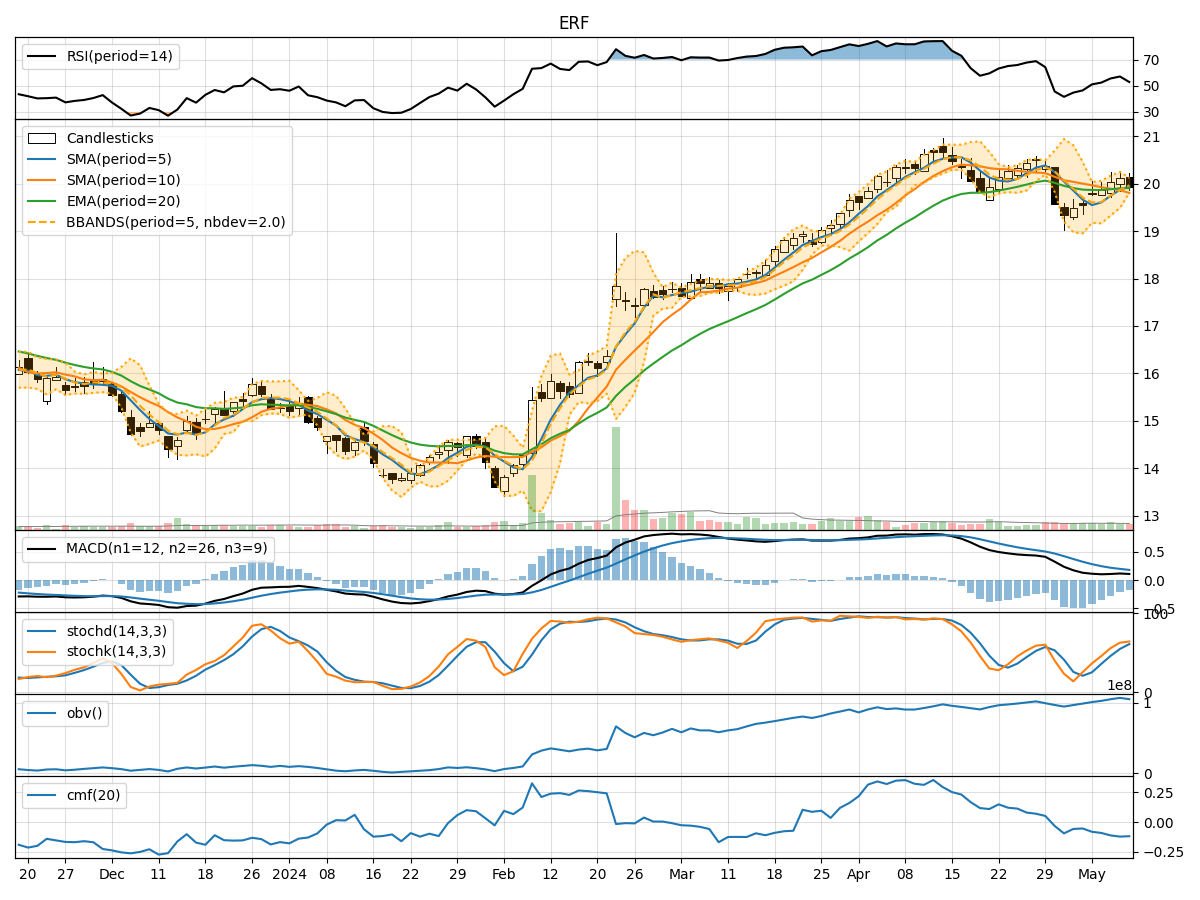
In analyzing the technical indicators for ERF over the last 5 days, we will delve into the trend, momentum, volatility, and volume indicators to provide a comprehensive outlook on the possible stock price movement in the coming days. By examining these key indicators, we aim to offer valuable insights and predictions to guide your investment decisions.
Trend Analysis:
- Moving Averages (MA): The 5-day Moving Average (MA) has been trending slightly above the Simple Moving Average (SMA) and Exponential Moving Average (EMA) over the past 5 days, indicating a short-term upward trend.
- MACD: The Moving Average Convergence Divergence (MACD) has shown positive values, with the MACD line consistently above the Signal line, suggesting bullish momentum in the stock price.
Momentum Analysis:
- RSI: The Relative Strength Index (RSI) has been fluctuating around the 50 level, indicating a neutral momentum in the stock.
- Stochastic Oscillator: Both %K and %D lines of the Stochastic Oscillator have been in the overbought territory, suggesting a potential reversal or consolidation phase.
Volatility Analysis:
- Bollinger Bands (BB): The Bollinger Bands have shown a narrowing of the bands, indicating decreasing volatility in the stock price.
- Bollinger %B (BBP): The %B indicator is below 1, suggesting that the stock price is trading below the upper Bollinger Band, potentially indicating a near-term pullback.
Volume Analysis:
- On-Balance Volume (OBV): The OBV indicator has been relatively flat, indicating a balance between buying and selling pressure.
- Chaikin Money Flow (CMF): The CMF has been negative, indicating a lack of buying pressure in the stock.
Key Observations:
- The trend indicators suggest a short-term upward bias in the stock price.
- Momentum indicators show a neutral stance with a potential for a reversal.
- Volatility indicators point towards decreasing volatility in the stock.
- Volume indicators indicate a lack of significant buying pressure in the stock.
Conclusion:
Based on the analysis of the technical indicators, the next few days' possible stock price movement for ERF could be sideways to slightly bearish. The stock may experience a period of consolidation or a minor pullback before potentially resuming its upward trend. Traders should exercise caution and consider waiting for clearer signals before making significant trading decisions.