Technical Analysis of ERO 2024-05-10
Overview:
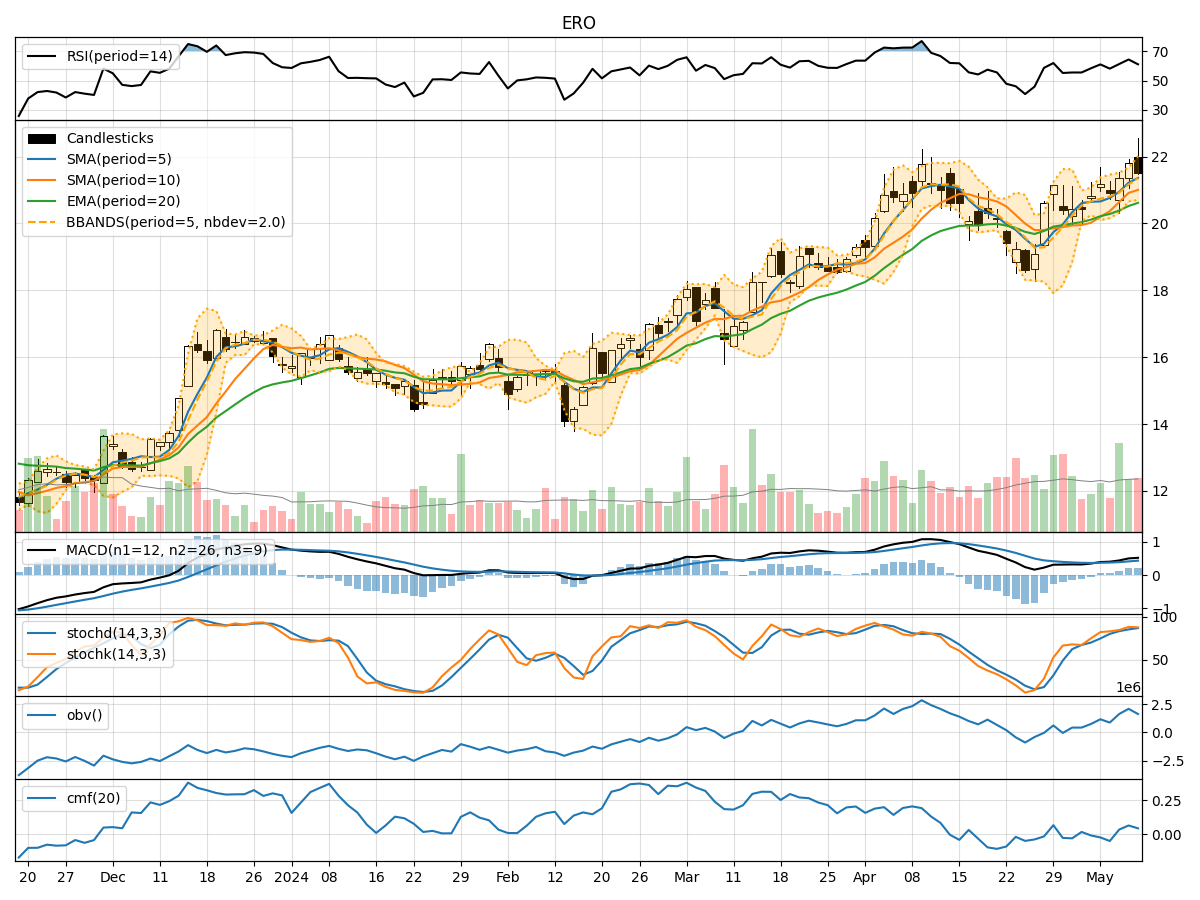
In analyzing the technical indicators for ERO stock over the last 5 days, we will delve into the trends, momentum, volatility, and volume indicators to provide a comprehensive outlook on the possible stock price movement in the coming days. By examining key metrics such as moving averages, MACD, RSI, Bollinger Bands, and OBV, we aim to offer valuable insights and predictions for potential price action.
Trend Indicators:
- Moving Averages (MA): The 5-day moving average has been consistently above the closing prices, indicating a bullish trend.
- MACD: The MACD line has been above the signal line, suggesting a positive momentum in the stock price.
- EMA: The exponential moving average has been trending upwards, supporting the bullish sentiment.
Key Observation: The trend indicators point towards an upward trend in the stock price.
Momentum Indicators:
- RSI: The Relative Strength Index has been fluctuating but generally staying above 50, indicating bullish momentum.
- Stochastic Oscillator: Both %K and %D have been in the overbought territory, signaling potential strength in the current uptrend.
- Williams %R: The Williams %R has been mostly negative, suggesting the stock is oversold.
Key Observation: Momentum indicators suggest a bullish sentiment in the stock.
Volatility Indicators:
- Bollinger Bands: The stock price has mostly stayed within the bands, indicating moderate volatility.
- Bollinger %B: The %B has been fluctuating around 0.5, suggesting the stock is trading near the middle of the bands.
Key Observation: Volatility indicators imply a sideways movement in the stock price.
Volume Indicators:
- On-Balance Volume (OBV): The OBV has been increasing, indicating higher buying volume in the stock.
- Chaikin Money Flow (CMF): The CMF has been positive, suggesting money flow into the stock.
Key Observation: Volume indicators support a bullish outlook for the stock.
Conclusion:
Based on the analysis of the technical indicators, the overall outlook for ERO stock in the next few days is bullish. The trend indicators, momentum indicators, and volume indicators all point towards a potential upward movement in the stock price. However, the volatility indicators suggest a sideways movement in the short term. Traders and investors may consider taking long positions in ERO stock, considering the positive momentum and volume support. It is essential to monitor the price action closely and set appropriate stop-loss levels to manage risk effectively.