Technical Analysis of ESAB 2024-05-10
Overview:
In the last 5 trading days, ESAB stock has shown a mix of bullish and bearish signals across various technical indicators. The stock price has been fluctuating within a certain range, indicating indecision in the market. By analyzing trend, momentum, volatility, and volume indicators, we can gain insights into the possible future price movement of ESAB stock.
Trend Indicators:
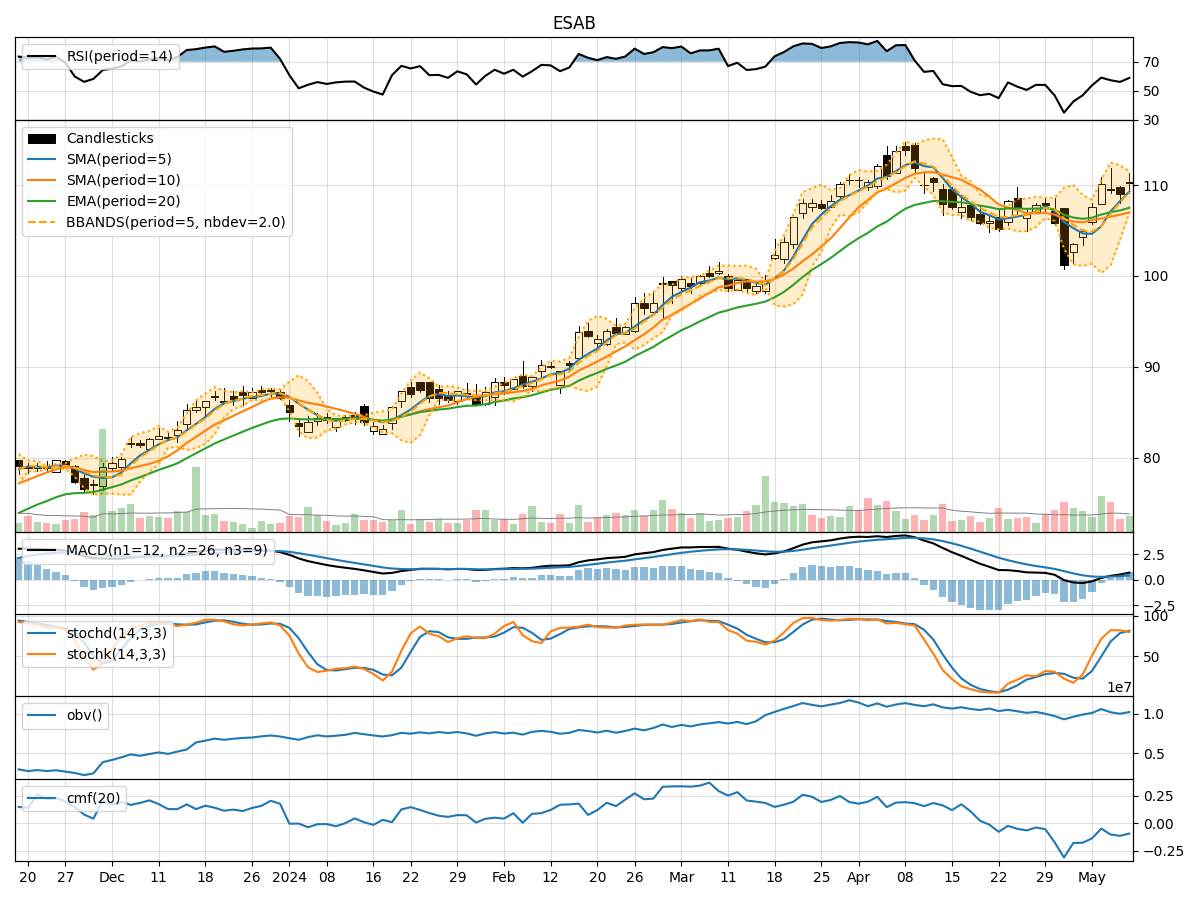
- Moving Averages (MA): The 5-day MA has been consistently above the closing price, indicating a short-term bullish trend. The SMA(10) and EMA(20) have also been trending upwards, supporting a bullish sentiment.
- MACD: The MACD line has been above the signal line for the past few days, suggesting bullish momentum. The MACD histogram has been increasing, indicating strengthening bullish momentum.
Momentum Indicators:
- RSI: The RSI has been fluctuating around the 50 level, indicating a neutral stance in momentum. It has not reached overbought or oversold levels, suggesting a lack of strong directional bias.
- Stochastic Oscillator: The Stochastic indicators have been in the overbought territory, signaling a potential reversal or consolidation in price.
Volatility Indicators:
- Bollinger Bands (BB): The price has been trading within the Bollinger Bands, suggesting a period of consolidation. The bands are not expanding significantly, indicating low volatility.
- Bollinger Band %B (BBP): The %B indicator is hovering around 0.5, indicating the price is at the middle of the bands, reinforcing the consolidation phase.
Volume Indicators:
- On-Balance Volume (OBV): The OBV has been relatively flat, indicating a balance between buying and selling pressure. There is no significant divergence in volume to confirm a strong trend.
- Chaikin Money Flow (CMF): The CMF has been negative, suggesting outflow of money from the stock. This indicates a bearish sentiment in terms of volume flow.
Conclusion:
Based on the analysis of technical indicators, the next few days for ESAB stock are likely to see sideways movement or consolidation. The lack of strong directional signals from momentum and volume indicators, coupled with the price trading within a tight range and low volatility, indicates a period of indecision in the market. Traders may expect the stock to continue trading within the current range without a clear trend in the near term. It is advisable to closely monitor key support and resistance levels for potential breakout or breakdown scenarios.