Technical Analysis of ESI 2024-05-10
Overview:
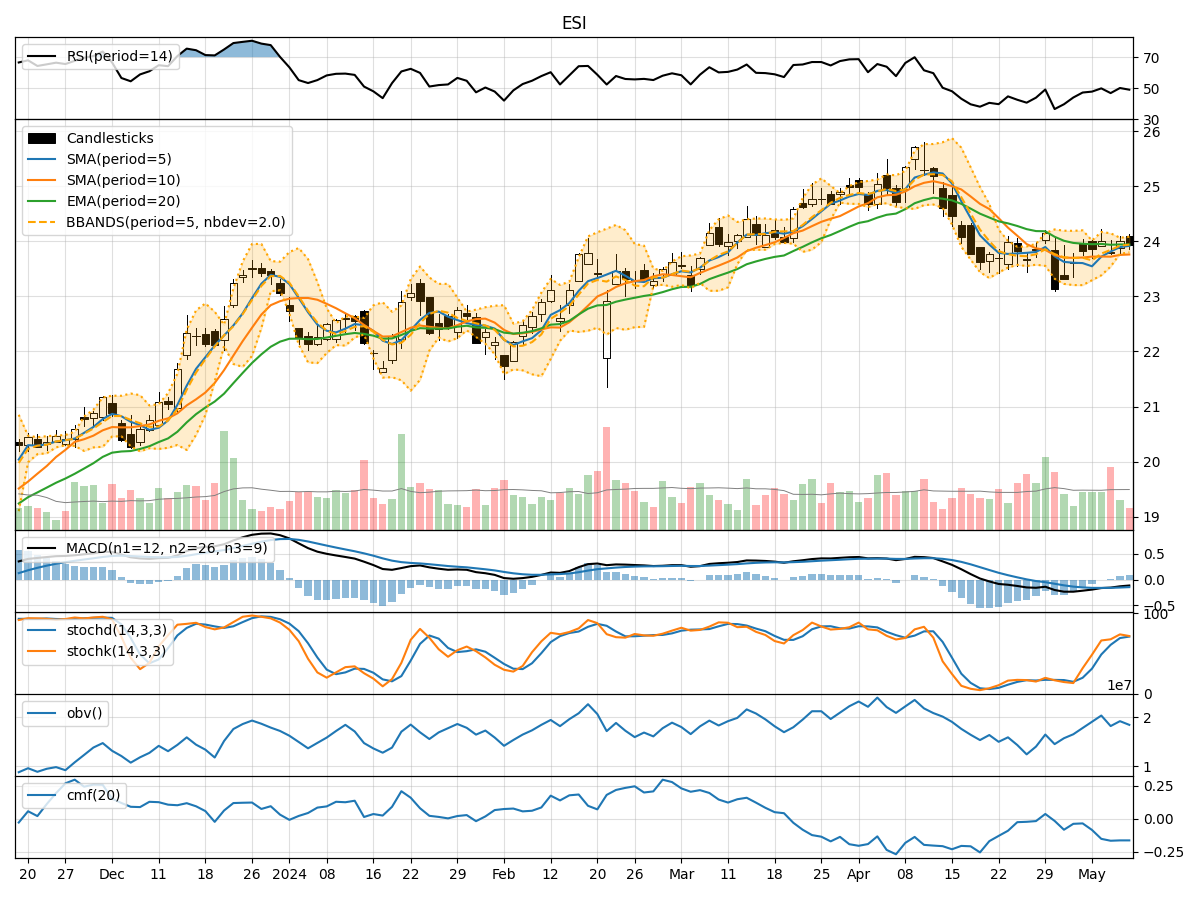
In the last 5 trading days, ESI stock has shown mixed signals across various technical indicators. The trend indicators suggest a slightly bearish sentiment, with the Moving Average Convergence Divergence (MACD) showing negative values. Momentum indicators are neutral to slightly bullish, while volatility indicators indicate a narrowing Bollinger Bands width. Volume indicators show a decrease in On-Balance Volume (OBV) and Chaikin Money Flow (CMF).
Trend Indicators:
- Moving Averages (MA) are relatively close to the current price, indicating a lack of strong trend direction.
- MACD is negative, suggesting a bearish momentum in the short term.
- Overall, the trend indicators point towards a slightly bearish sentiment.
Momentum Indicators:
- Relative Strength Index (RSI) is neutral, not indicating any extreme overbought or oversold conditions.
- Stochastic Oscillator shows a bullish crossover but is approaching overbought levels.
- Williams %R is in the oversold region, potentially signaling a reversal.
- Momentum indicators are neutral to slightly bullish.
Volatility Indicators:
- Bollinger Bands are narrowing, indicating decreasing volatility and a potential upcoming breakout.
- Bollinger Bands Percentage (BBP) is relatively low, suggesting a period of consolidation.
- Volatility indicators point towards a potential breakout due to the narrowing bands.
Volume Indicators:
- On-Balance Volume (OBV) has been decreasing, indicating selling pressure.
- Chaikin Money Flow (CMF) is negative, suggesting a lack of buying interest.
- Volume indicators reflect a bearish sentiment with decreasing buying pressure.
Conclusion:
Based on the analysis of the technical indicators, the next few days for ESI stock are likely to see further downside movement. The trend indicators show a slightly bearish sentiment, supported by negative MACD values. Momentum indicators are neutral to slightly bullish, which might provide some short-term support. However, the volatility indicators suggest a potential breakout, possibly to the downside, due to the narrowing Bollinger Bands. Volume indicators also support a bearish view with decreasing OBV and negative CMF.
Therefore, the overall outlook for ESI stock in the next few days is bearish, with a higher probability of downward price movement. Traders and investors should exercise caution and consider implementing risk management strategies to navigate potential downside risks.