Technical Analysis of ETWO 2024-05-31
Overview:
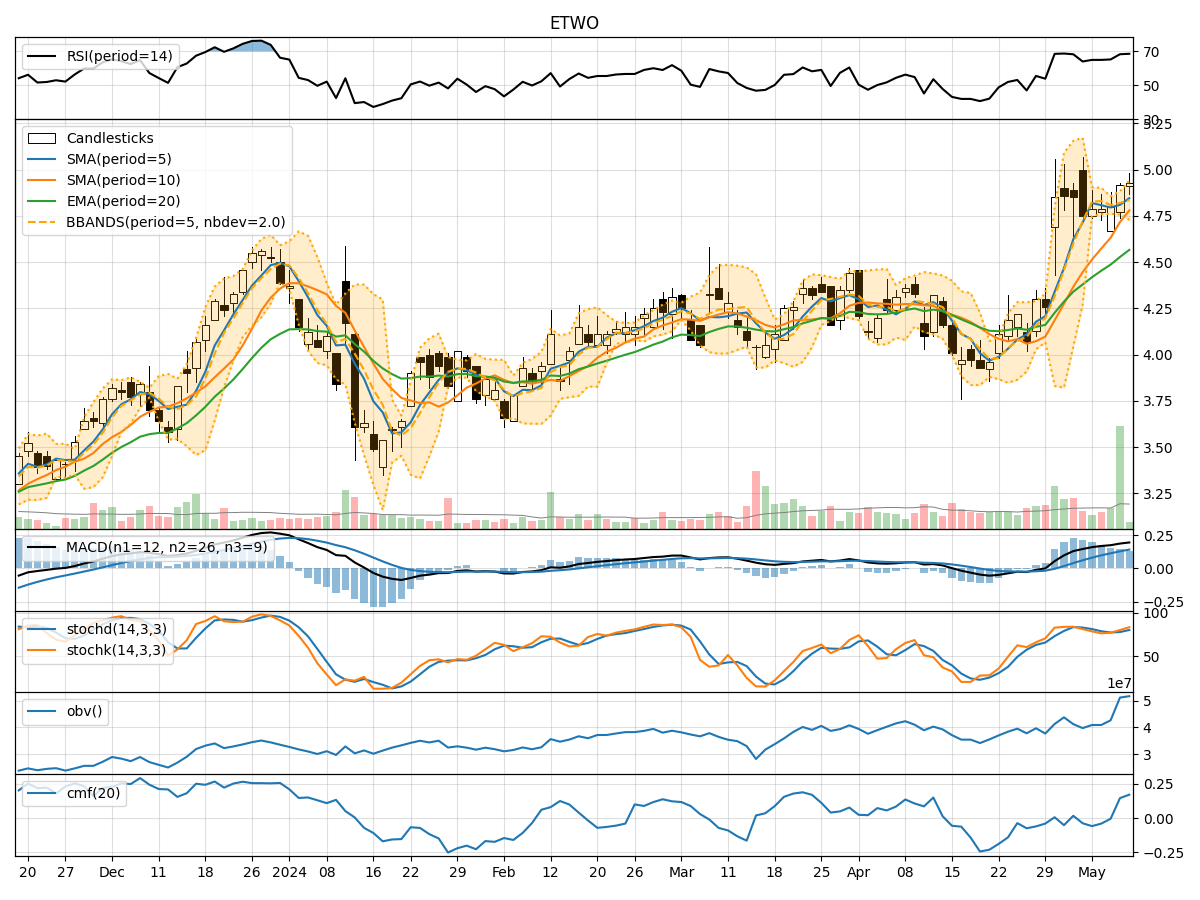
In analyzing the technical indicators for ETWO over the last 5 days, we will delve into the trend, momentum, volatility, and volume indicators to provide a comprehensive outlook on the possible stock price movement in the coming days.
Trend Analysis:
- Moving Averages (MA): The 5-day MA has been consistently below the closing price, indicating a short-term downtrend.
- MACD: The MACD line has been above the signal line, suggesting a bullish momentum.
- EMA: The EMA has been gradually decreasing, reflecting a bearish sentiment in the longer term.
Momentum Analysis:
- RSI: The RSI has been fluctuating around the 50 level, indicating a lack of strong momentum.
- Stochastic Oscillator: Both %K and %D have been declining, signaling a potential oversold condition.
- Williams %R: The indicator has been consistently in the oversold territory, suggesting a bearish sentiment.
Volatility Analysis:
- Bollinger Bands (BB): The bands have been narrowing, indicating decreasing volatility.
- BB %B: The %B has been decreasing, reflecting a potential consolidation phase.
- BB Width: The width of the bands has been contracting, signaling a period of low volatility.
Volume Analysis:
- On-Balance Volume (OBV): The OBV has been fluctuating, indicating indecision among market participants.
- Chaikin Money Flow (CMF): The CMF has been relatively stable, suggesting a neutral sentiment towards the stock.
Key Observations:
- The stock is currently in a short-term downtrend based on moving averages.
- Momentum indicators suggest a lack of strong buying interest.
- Volatility is decreasing, indicating a potential period of consolidation.
- Volume indicators show mixed signals, reflecting uncertainty in market participation.
Conclusion:
Based on the analysis of technical indicators, the next few days for ETWO are likely to see sideways movement with a slight bearish bias. The stock may consolidate within a narrow range as volatility remains low, and momentum indicators do not show a clear direction. Traders should exercise caution and wait for stronger signals before taking significant positions.