Technical Analysis of EURN 2024-05-10
Overview:
In analyzing the technical indicators for EURN over the last 5 days, we will delve into the trend, momentum, volatility, and volume indicators to provide a comprehensive outlook on the possible stock price movement in the coming days. By examining these key indicators, we aim to offer valuable insights and predictions for potential investors.
Trend Analysis:
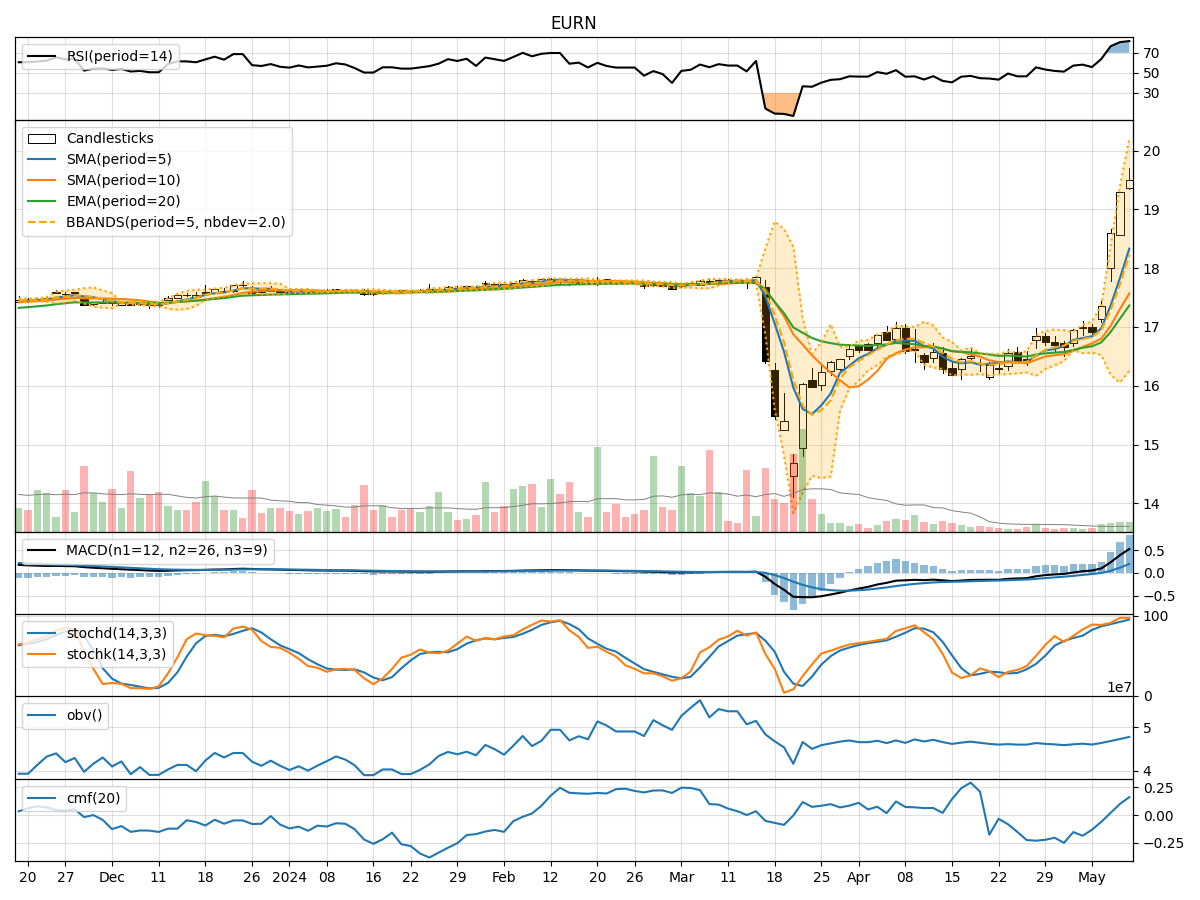
- Moving Averages (MA): The moving averages have been showing an upward trend, with the 5-day MA consistently rising above the longer-term SMAs and EMAs. This indicates a bullish momentum in the stock price.
- MACD: The MACD line has been consistently above the signal line, with both lines showing an upward trajectory. The MACD histogram has also been increasing, indicating strengthening bullish momentum.
Momentum Analysis:
- RSI: The RSI has been trending upwards and is currently in the overbought territory, suggesting a strong bullish momentum in the stock.
- Stochastic Oscillator: Both %K and %D lines of the stochastic oscillator have been in the overbought zone, indicating a strong buying pressure in the market.
- Williams %R: The Williams %R is also in the oversold region, suggesting a potential reversal in the stock price.
Volatility Analysis:
- Bollinger Bands: The Bollinger Bands have been widening, indicating increased volatility in the stock price. The upper band has been consistently breached, suggesting a potential continuation of the bullish trend.
- Bollinger %B: The %B indicator has been hovering above 0.8, indicating that the stock is trading near the upper Bollinger Band, which could signal an overbought condition.
Volume Analysis:
- On-Balance Volume (OBV): The OBV indicator has been steadily increasing over the past 5 days, reflecting strong buying volume in the stock.
- Chaikin Money Flow (CMF): The CMF has been positive and rising, indicating that money is flowing into the stock, supporting the bullish momentum.
Conclusion:
Based on the analysis of the technical indicators, the overall outlook for EURN is strongly bullish. The trend indicators, momentum oscillators, volatility measures, and volume indicators all point towards a continuation of the upward trend in the stock price. Investors may consider buying EURN as the stock shows potential for further price appreciation in the coming days. It is important to monitor the indicators closely for any signs of reversal or consolidation, but the current market dynamics suggest a favorable environment for bullish price movements.