Technical Analysis of EVEX 2024-05-10
Overview:
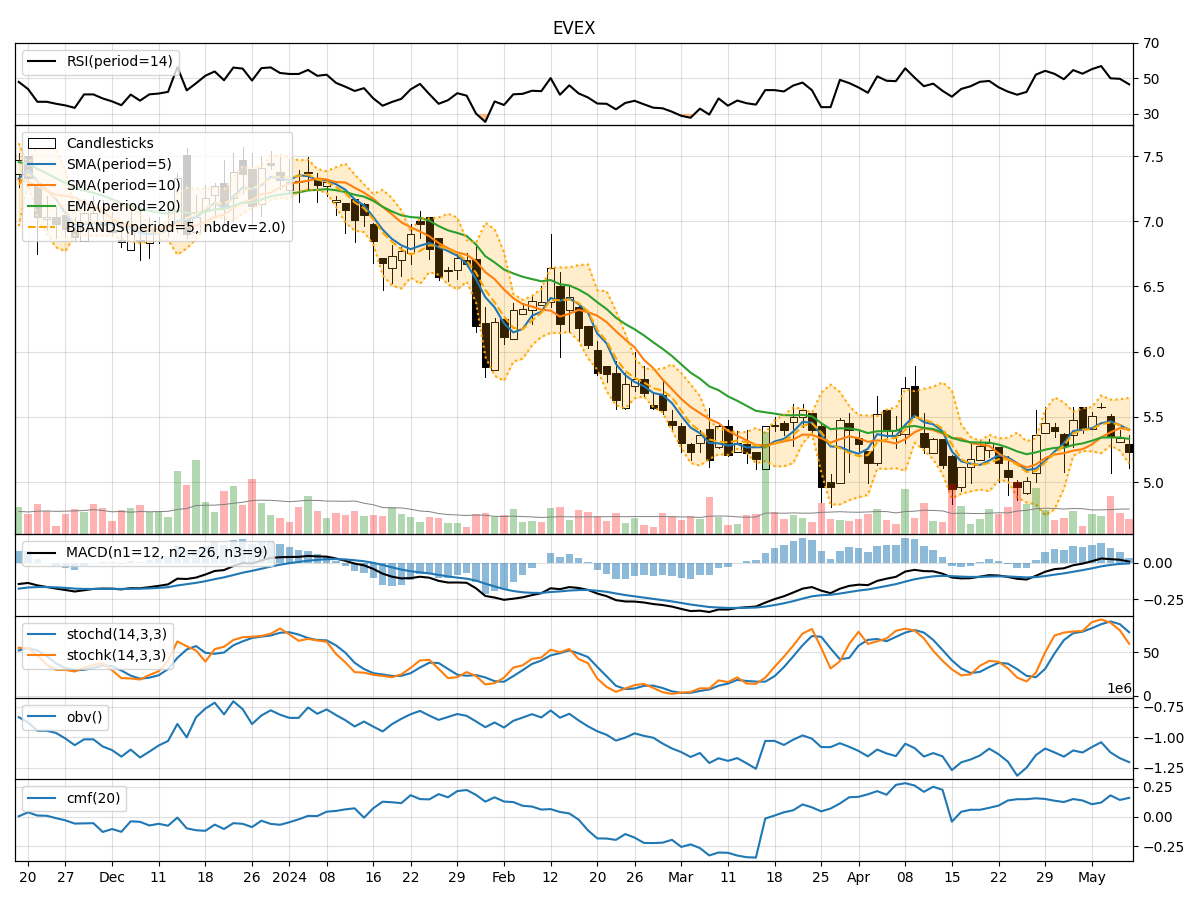
In the last 5 trading days, EVEX stock has shown mixed signals across various technical indicators. The trend indicators suggest a slight bullish sentiment, with the moving averages and MACD showing positive trends. Momentum indicators indicate a weakening bullish momentum, while volatility indicators show fluctuating price movements. Volume indicators suggest a decrease in buying pressure.
Trend Indicators:
- Moving Averages (MA): The 5-day moving average has been above the 10-day simple moving average, indicating a short-term bullish trend.
- MACD: The MACD line has been consistently above the signal line, indicating a bullish trend.
- EMA: The exponential moving average has been relatively stable, suggesting a potential consolidation phase.
Momentum Indicators:
- RSI: The Relative Strength Index has been fluctuating around the neutral zone, indicating indecision in the market.
- Stochastic Oscillator: The stochastic indicators have been declining, suggesting a potential reversal in momentum.
- Williams %R: The Williams %R is in oversold territory, indicating a possible buying opportunity.
Volatility Indicators:
- Bollinger Bands: The Bollinger Bands have shown widening and narrowing, indicating fluctuating volatility.
- Bollinger %B: The %B indicator has been fluctuating, suggesting mixed signals in terms of volatility.
Volume Indicators:
- On-Balance Volume (OBV): The OBV has been declining, indicating a decrease in buying pressure.
- Chaikin Money Flow (CMF): The CMF has been relatively stable, suggesting a neutral sentiment towards the stock.
Key Observations:
- The trend indicators suggest a short-term bullish sentiment, supported by moving averages and MACD.
- Momentum indicators show a weakening bullish momentum, indicating a potential reversal.
- Volatility indicators reflect fluctuating price movements, with no clear trend in volatility.
- Volume indicators indicate a decrease in buying pressure, potentially signaling a shift in market sentiment.
Conclusion:
Based on the analysis of technical indicators, the next few days' possible stock price movement for EVEX is likely to experience a consolidation phase with a slight bearish bias. The weakening momentum, fluctuating volatility, and decreasing buying pressure suggest a potential reversal or sideways movement in the stock price. Traders should exercise caution and consider waiting for more definitive signals before making significant trading decisions.