Technical Analysis of EXPD 2024-05-10
Overview:
In analyzing the technical indicators for EXPD over the last 5 days, we will delve into the trend, momentum, volatility, and volume indicators to provide a comprehensive outlook on the possible stock price movement in the coming days.
Trend Analysis:
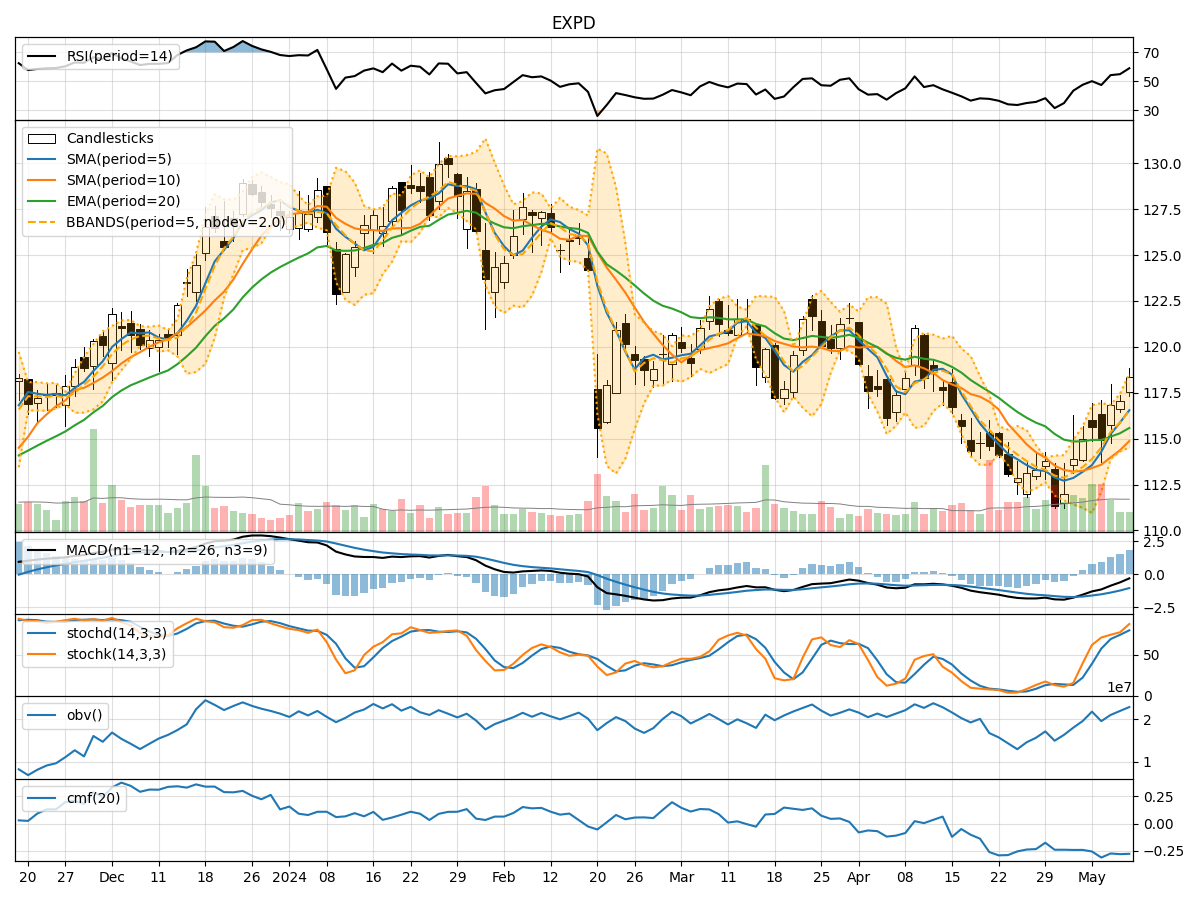
- Moving Averages (MA): The 5-day Moving Average (MA) has been consistently rising, indicating a bullish trend in the short term.
- MACD: The MACD line has been positive and increasing, suggesting upward momentum in the stock price.
- EMA: The Exponential Moving Average (EMA) has been trending upwards, supporting the bullish sentiment.
Momentum Analysis:
- RSI: The Relative Strength Index (RSI) has been in the neutral zone, indicating neither overbought nor oversold conditions.
- Stochastic Oscillator: Both %K and %D have been in the overbought territory, signaling potential for a pullback.
- Williams %R: The Williams %R is in the oversold region, suggesting a possible reversal in the stock price.
Volatility Analysis:
- Bollinger Bands: The stock price has been trading within the Bollinger Bands, indicating normal volatility.
- Bollinger %B: The %B indicator is around the midline, suggesting a balanced market sentiment.
Volume Analysis:
- On-Balance Volume (OBV): The OBV has been fluctuating, indicating mixed buying and selling pressure.
- Chaikin Money Flow (CMF): The CMF has been negative, suggesting outflow of money from the stock.
Key Observations:
- The trend indicators point towards a bullish sentiment in the short term.
- Momentum indicators show conflicting signals with RSI neutral, Stochastic overbought, and Williams %R oversold.
- Volatility remains stable within the Bollinger Bands.
- Volume indicators reflect mixed buying and selling pressure.
Conclusion:
Based on the analysis of the technical indicators, the stock price of EXPD is likely to experience further upward movement in the coming days. The bullish trend indicated by moving averages and MACD, coupled with the positive EMA, suggests a potential for price appreciation. However, caution is advised as momentum indicators show conflicting signals, indicating a possible short-term correction or consolidation. Traders should closely monitor the Stochastic and Williams %R for potential reversal points. Overall, the outlook for EXPD remains bullish with a possibility of short-term consolidation before resuming the upward trend.