Technical Analysis of FAF 2024-05-10
Overview:
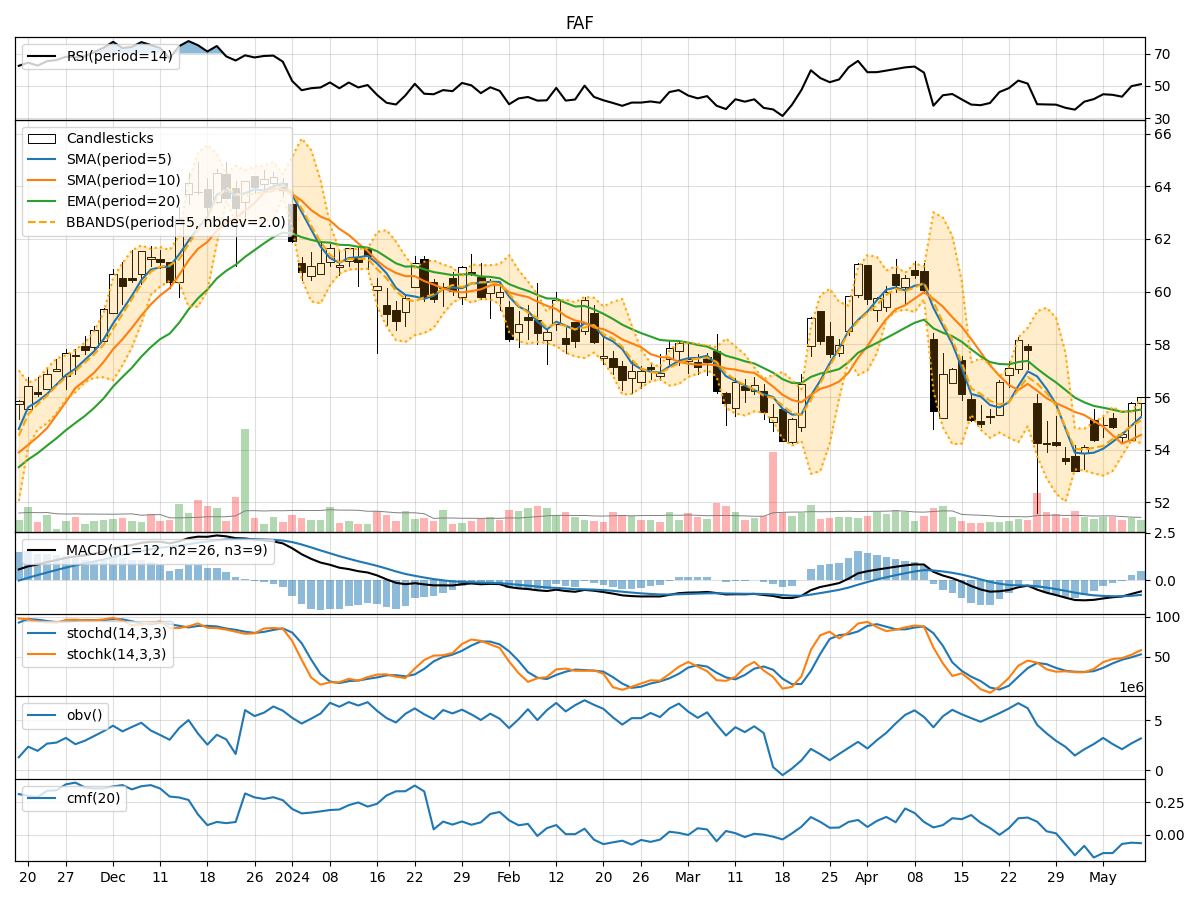
In analyzing the technical indicators for FAF over the last 5 days, we will delve into the trend, momentum, volatility, and volume indicators to provide a comprehensive outlook on the possible stock price movement in the coming days.
Trend Analysis:
- Moving Averages (MA): The 5-day Moving Average (MA) has been trending upwards, indicating a positive momentum in the stock price.
- MACD: The MACD line has been consistently below the signal line, suggesting a bearish trend in the short term.
- RSI: The Relative Strength Index (RSI) has been fluctuating around the midline, indicating a lack of strong trend direction.
Momentum Analysis:
- Stochastic Oscillator: The Stochastic Oscillator has been rising, reflecting increasing buying pressure.
- Williams %R: The Williams %R is in the oversold territory, signaling a potential reversal in the stock price.
Volatility Analysis:
- Bollinger Bands: The Bollinger Bands have been widening, indicating increased volatility in the stock price.
- Average True Range (ATR): The ATR has shown an uptrend, suggesting higher price fluctuations.
Volume Analysis:
- On-Balance Volume (OBV): The OBV has been fluctuating, indicating mixed buying and selling pressure.
- Chaikin Money Flow (CMF): The CMF has been negative, suggesting a lack of strong buying interest.
Key Observations:
- The stock is currently in a bullish phase based on the moving averages and stochastic oscillator.
- However, the MACD and RSI indicate a bearish sentiment in the short term.
- Volatility is increasing, which could lead to larger price swings.
- The volume indicators show mixed signals, with no clear trend in buying or selling pressure.
Conclusion:
Based on the analysis of the technical indicators, the next few days' possible stock price movement for FAF is likely to be volatile with a mixed outlook. Traders should exercise caution and closely monitor key levels such as support and resistance for potential entry and exit points. The stock may experience sideways consolidation in the near term until a clear trend direction emerges.