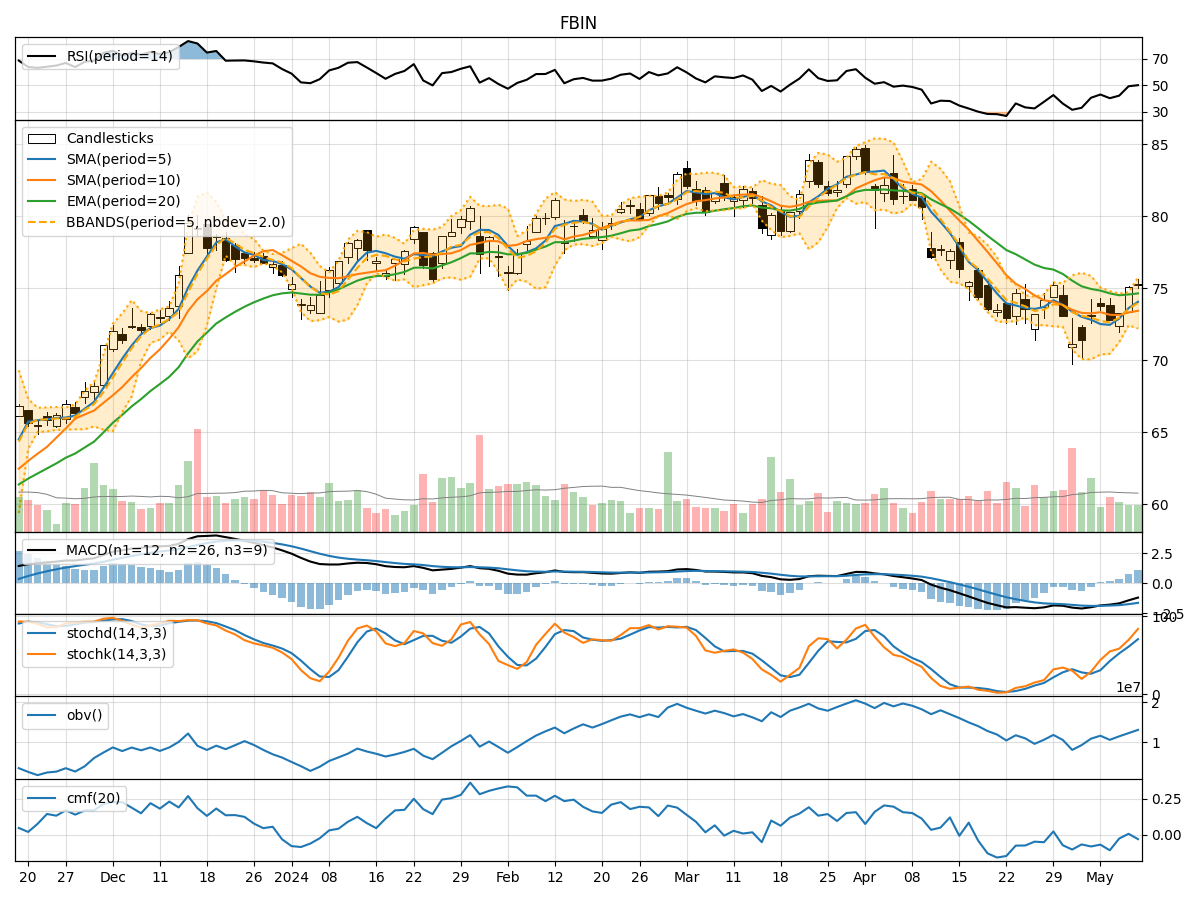
Technical Analysis of FBIN 2024-05-10
Overview:
In analyzing the technical indicators for FBIN over the last 5 days, we will delve into the trend, momentum, volatility, and volume indicators to provide a comprehensive outlook on the possible stock price movement in the coming days. By examining these key aspects, we aim to offer valuable insights and predictions to guide your investment decisions.
Trend Analysis:
- Moving Averages (MA): The 5-day Moving Average (MA) has been fluctuating around the Simple Moving Average (SMA) and Exponential Moving Average (EMA) values, indicating a lack of clear trend direction.
- MACD: The Moving Average Convergence Divergence (MACD) has shown negative values, suggesting a bearish momentum in the short term.
- Conclusion: The trend indicators point towards a sideways movement with a slight bearish bias.
Momentum Analysis:
- RSI: The Relative Strength Index (RSI) has been hovering around the mid-range, indicating a neutral momentum.
- Stochastic Oscillator: Both %K and %D values have been increasing, signaling a strengthening bullish momentum.
- Conclusion: The momentum indicators suggest a neutral to slightly bullish sentiment in the near future.
Volatility Analysis:
- Bollinger Bands (BB): The Bollinger Bands have been widening, indicating increased volatility in the stock price.
- Conclusion: The volatility indicators point towards increased price fluctuations in the upcoming days.
Volume Analysis:
- On-Balance Volume (OBV): The OBV has shown mixed movements, reflecting uncertainty in the buying and selling pressure.
- Chaikin Money Flow (CMF): The CMF has been negative, indicating a bearish money flow trend.
- Conclusion: The volume indicators suggest a lack of strong buying interest and a bearish sentiment in the market.
Overall Conclusion:
Based on the analysis of the technical indicators, the next few days for FBIN are likely to see a sideways movement with a bearish bias. The trend indicators point towards a lack of clear direction, while the momentum indicators suggest a neutral to slightly bullish sentiment. Increased volatility is expected, indicating higher price fluctuations, and the volume indicators reflect a bearish money flow trend.
Recommendation:
Considering the overall analysis, it is advisable to exercise caution in trading FBIN in the coming days. Traders may consider implementing risk management strategies to navigate the increased volatility and bearish sentiment. Long-term investors might find it prudent to wait for more clarity in the trend direction before making significant investment decisions.
Disclaimer:
Please note that technical analysis is not a guaranteed predictor of future price movements, and market dynamics can change rapidly. It is essential to conduct thorough research, consider fundamental factors, and consult with financial advisors before making any investment decisions.