Technical Analysis of FCN 2024-05-10
Overview:
In analyzing the technical indicators for FCN over the last 5 days, we will delve into the trend, momentum, volatility, and volume indicators to provide a comprehensive outlook on the possible stock price movement. By examining these key aspects, we aim to offer valuable insights and predictions for the upcoming days.
Trend Analysis:
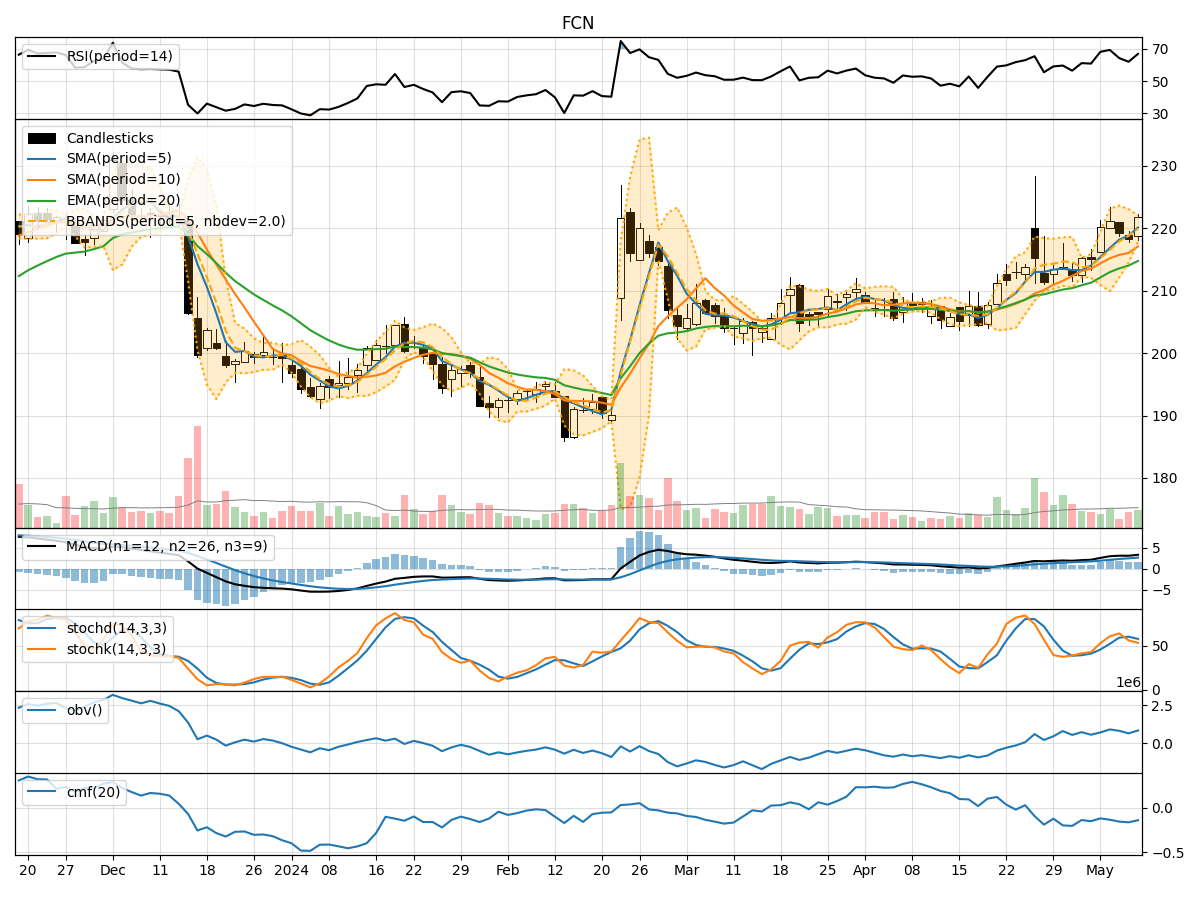
- Moving Averages (MA): The 5-day Moving Average (MA) has been consistently above the Simple Moving Average (SMA) and Exponential Moving Average (EMA), indicating a bullish trend.
- MACD: The MACD line has been above the signal line, with both lines showing an upward trend, suggesting bullish momentum.
Momentum Analysis:
- RSI: The Relative Strength Index (RSI) has been fluctuating around the 60-70 range, indicating a neutral to slightly bullish momentum.
- Stochastic Oscillator: The Stochastic Oscillator has been moving within the overbought territory, suggesting a potential reversal or consolidation.
Volatility Analysis:
- Bollinger Bands (BB): The Bollinger Bands have been narrowing, indicating decreasing volatility and a potential upcoming breakout.
Volume Analysis:
- On-Balance Volume (OBV): The OBV has been fluctuating, indicating indecision among investors.
- Chaikin Money Flow (CMF): The CMF has been negative, suggesting selling pressure in the market.
Key Observations:
- The trend indicators suggest a bullish sentiment, supported by the moving averages and MACD.
- Momentum indicators show a neutral to slightly bullish stance, with RSI hovering in the middle range.
- Volatility is decreasing, as indicated by the narrowing Bollinger Bands.
- Volume indicators reflect indecision and selling pressure in the market.
Conclusion:
Based on the analysis of the technical indicators, the next few days for FCN could see further upward movement in the stock price. The bullish trend supported by moving averages and MACD, coupled with decreasing volatility, indicates a potential breakout to the upside. However, caution is advised due to the overbought levels in the Stochastic Oscillator and the negative CMF, which suggest a possible consolidation or pullback in the short term.
Recommendation:
- Short-term Traders: Consider taking profits or setting tight stop-loss orders to protect gains.
- Long-term Investors: Monitor the price action closely for a potential entry point or accumulation zone.
- Risk Management: Stay vigilant of market conditions and adjust positions accordingly to manage risk effectively.
By combining technical analysis with market dynamics, this assessment aims to provide a well-rounded perspective on the potential stock price movement for FCN in the coming days.