Technical Analysis of FENG 2024-05-10
Overview:
In analyzing the technical indicators for FENG over the last 5 days, we will delve into the trend, momentum, volatility, and volume indicators to provide a comprehensive outlook on the possible stock price movement in the coming days.
Trend Analysis:
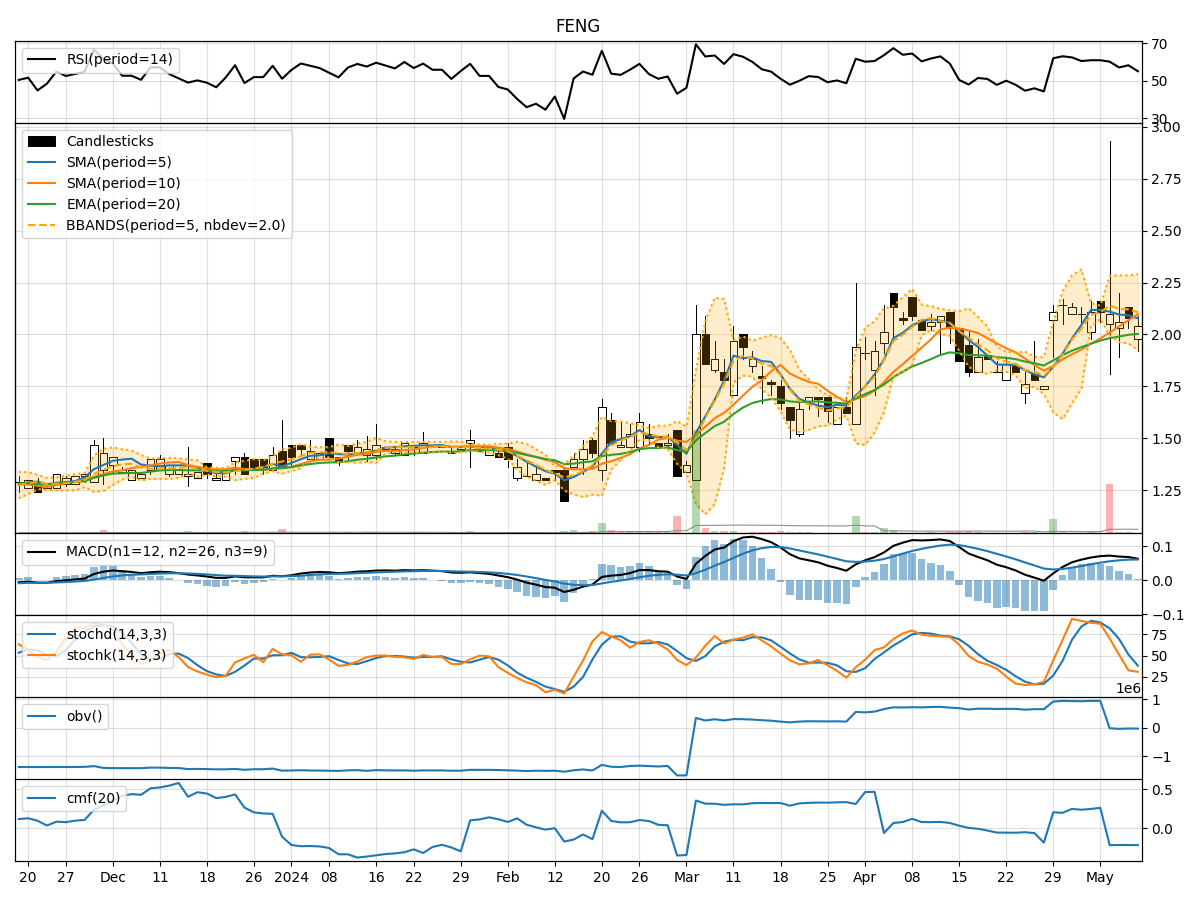
- Moving Averages (MA): The 5-day Moving Average (MA) has been fluctuating around the current stock price, indicating a short-term trend. The Simple Moving Average (SMA) and Exponential Moving Average (EMA) show a slight uptrend.
- MACD: The MACD line has been positive, indicating a bullish trend, although the MACD Histogram has been decreasing slightly.
Momentum Analysis:
- RSI: The Relative Strength Index (RSI) has been hovering around 50, suggesting a neutral momentum.
- Stochastic Oscillator: Both %K and %D have been in the oversold region, indicating a potential reversal.
Volatility Analysis:
- Bollinger Bands (BB): The stock price has been within the Bollinger Bands, suggesting a period of consolidation.
Volume Analysis:
- On-Balance Volume (OBV): The OBV has been relatively stable, indicating a balance between buying and selling pressure.
- Chaikin Money Flow (CMF): The CMF has been negative, indicating a slight outflow of money from the stock.
Key Observations:
- The trend indicators show a mixed signal with a slight bullish bias.
- Momentum indicators suggest a neutral to oversold momentum.
- Volatility indicators point towards a period of consolidation.
- Volume indicators indicate a balance between buying and selling pressure.
Conclusion:
Based on the analysis of the technical indicators, the next few days for FENG could see sideways movement with a slight bullish bias. Traders may expect the stock price to consolidate within a range, potentially with some upward movement. It is advisable to closely monitor the momentum indicators for any signs of a reversal and to set appropriate stop-loss levels to manage risk effectively.