Technical Analysis of FHI 2024-05-10
Overview:
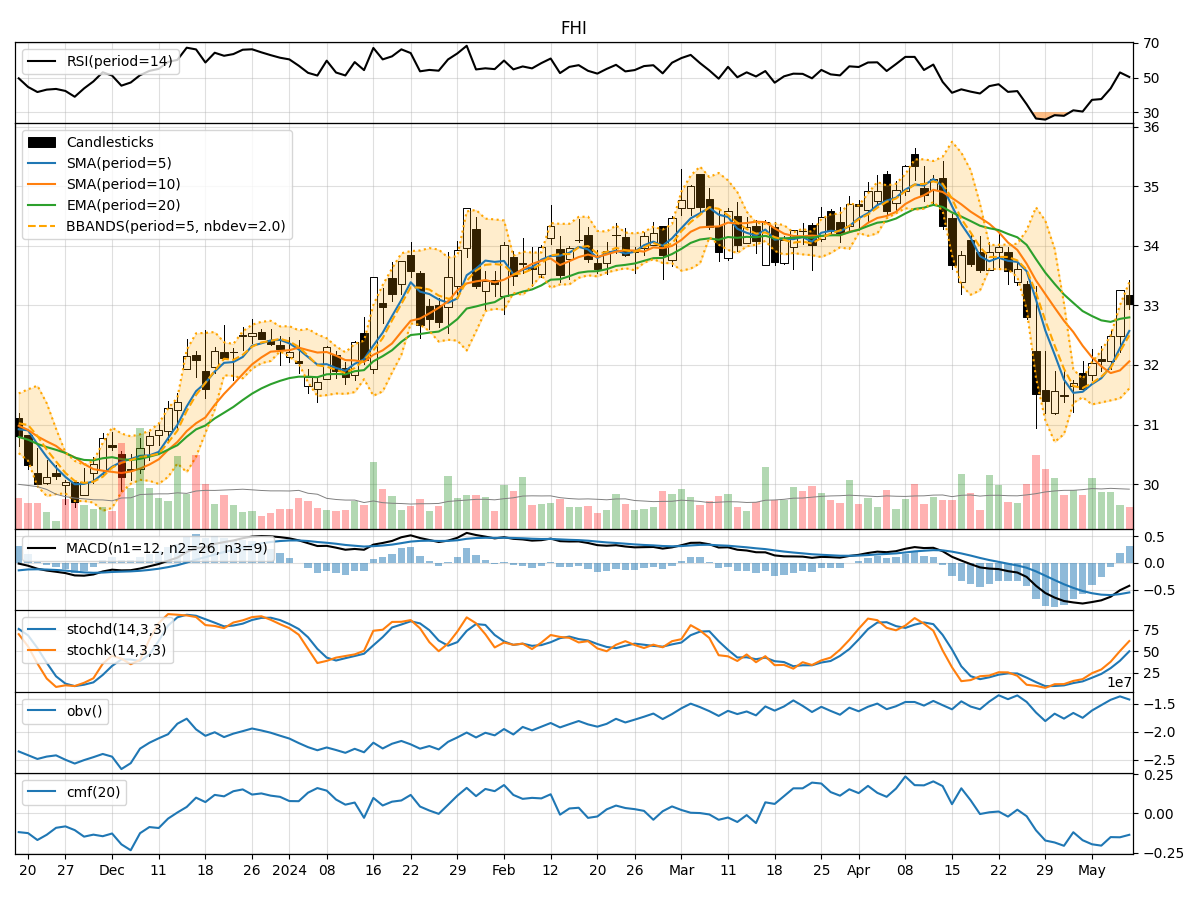
In analyzing the technical indicators for FHI over the last 5 days, we will delve into the trend, momentum, volatility, and volume indicators to provide a comprehensive outlook on the possible stock price movement in the coming days.
Trend Analysis:
- Moving Averages (MA): The 5-day MA has been showing an upward trend, indicating a positive momentum in the stock price.
- MACD: The MACD line has been consistently below the signal line, suggesting a bearish trend in the short term.
- EMA: The EMA has been relatively stable, indicating a potential consolidation phase in the stock price.
Momentum Analysis:
- RSI: The RSI has been fluctuating but is currently in the neutral zone, suggesting a balanced momentum in the stock.
- Stochastic Oscillator: Both %K and %D have been rising, indicating increasing buying pressure in the stock.
- Williams %R: The Williams %R is in the oversold territory, signaling a potential buying opportunity.
Volatility Analysis:
- Bollinger Bands (BB): The bands have been widening, indicating increased volatility in the stock price.
- BB %B: The %B is relatively low, suggesting a possible oversold condition in the stock.
- BB Width: The widening of the bands suggests a potential increase in price volatility.
Volume Analysis:
- On-Balance Volume (OBV): The OBV has been fluctuating but is relatively stable, indicating a balance between buying and selling pressure.
- Chaikin Money Flow (CMF): The CMF has been negative, suggesting a net outflow of money from the stock.
Conclusion:
Based on the analysis of the technical indicators, the stock of FHI is likely to experience sideways movement in the coming days. The trend indicators show a mixed signal with a slight bullish bias from the moving averages, while the momentum indicators suggest a neutral to slightly bullish sentiment. The volatility indicators point towards increased price fluctuations, which could lead to choppy trading sessions. The volume indicators indicate a balance between buying and selling pressure, further supporting the sideways outlook.
In conclusion, the stock price of FHI is expected to consolidate in the near term, with limited upside potential. Traders may consider adopting a cautious approach and wait for clearer signals before taking any significant positions.