Technical Analysis of FI 2024-05-10
Overview:
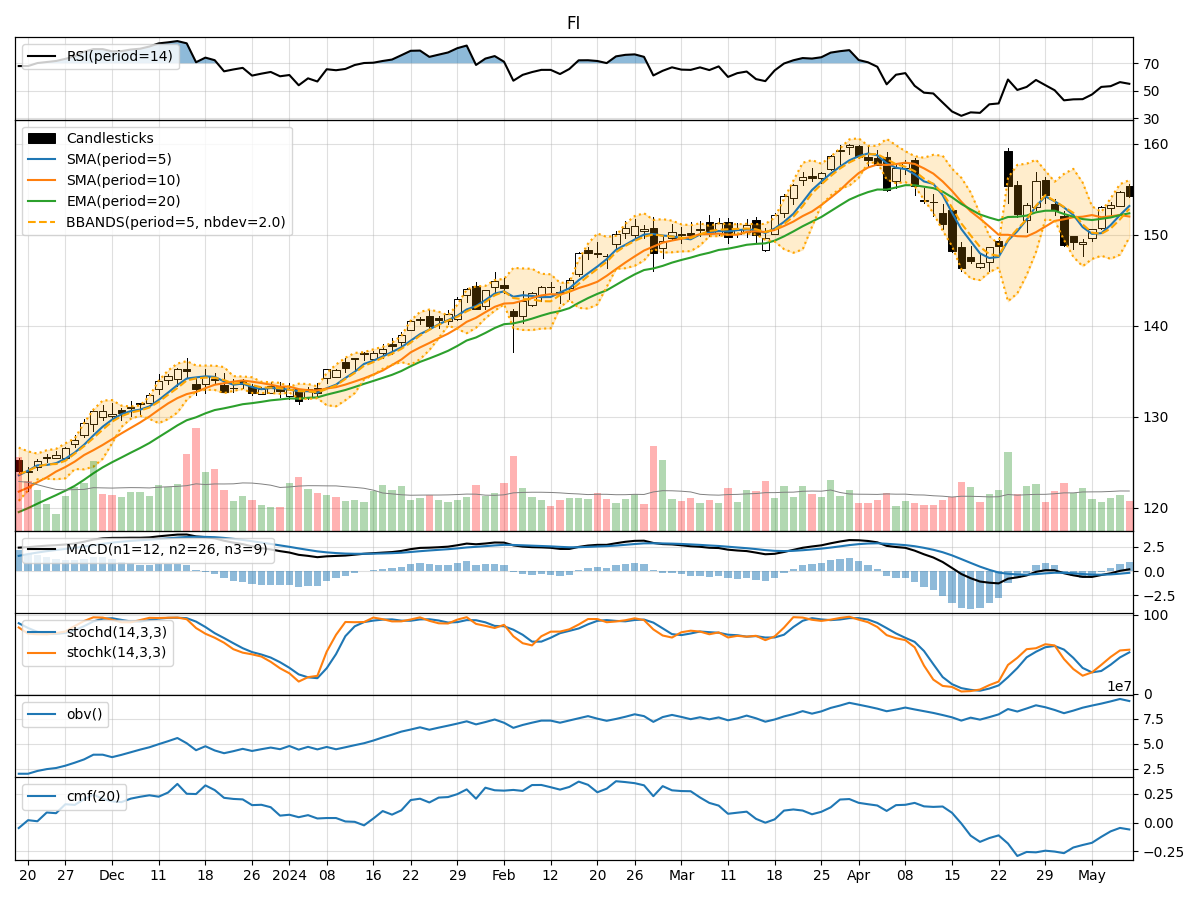
In the last 5 trading days, the stock price has shown a slight increase from 150.59 to 154.22. Various technical indicators have been analyzed, including trend indicators, momentum indicators, volatility indicators, and volume indicators. These indicators provide insights into the potential future movement of the stock price.
Trend Indicators:
- Moving Averages (MA): The 5-day moving average has been consistently increasing, indicating a short-term uptrend in the stock price.
- MACD: The MACD line has been trending upwards, and the MACD histogram has been showing positive values, suggesting bullish momentum.
- RSI: The RSI has been fluctuating around the 50 level, indicating a neutral stance in terms of momentum.
Momentum Indicators:
- Stochastic Oscillator: Both %K and %D have been rising, indicating increasing buying pressure.
- Williams %R: The Williams %R has been improving but still in oversold territory, suggesting a potential reversal.
Volatility Indicators:
- Bollinger Bands: The stock price has been trading within the Bollinger Bands, with the bands widening slightly, indicating increased volatility.
- Bollinger %B: The %B indicator is below 1, suggesting the stock is trading below the lower Bollinger Band.
Volume Indicators:
- On-Balance Volume (OBV): The OBV has been increasing, indicating accumulation by investors.
- Chaikin Money Flow (CMF): The CMF has been negative, suggesting selling pressure in the stock.
Key Observations:
- The stock price has been in an uptrend based on moving averages and MACD.
- Momentum indicators show a potential for further upside with improving Stochastic Oscillator and Williams %R.
- Volatility has increased slightly, as seen in the widening Bollinger Bands.
- Volume indicators suggest mixed signals with OBV showing accumulation but CMF indicating selling pressure.
Conclusion:
Based on the analysis of the technical indicators, the next few days' possible stock price movement could be upward. The uptrend indicated by moving averages and MACD, coupled with improving momentum indicators, suggests a bullish bias. However, the increased volatility and mixed volume signals warrant caution. Traders should monitor the price action closely for any signs of reversal or consolidation.