Technical Analysis of FIS 2024-05-10
Overview:
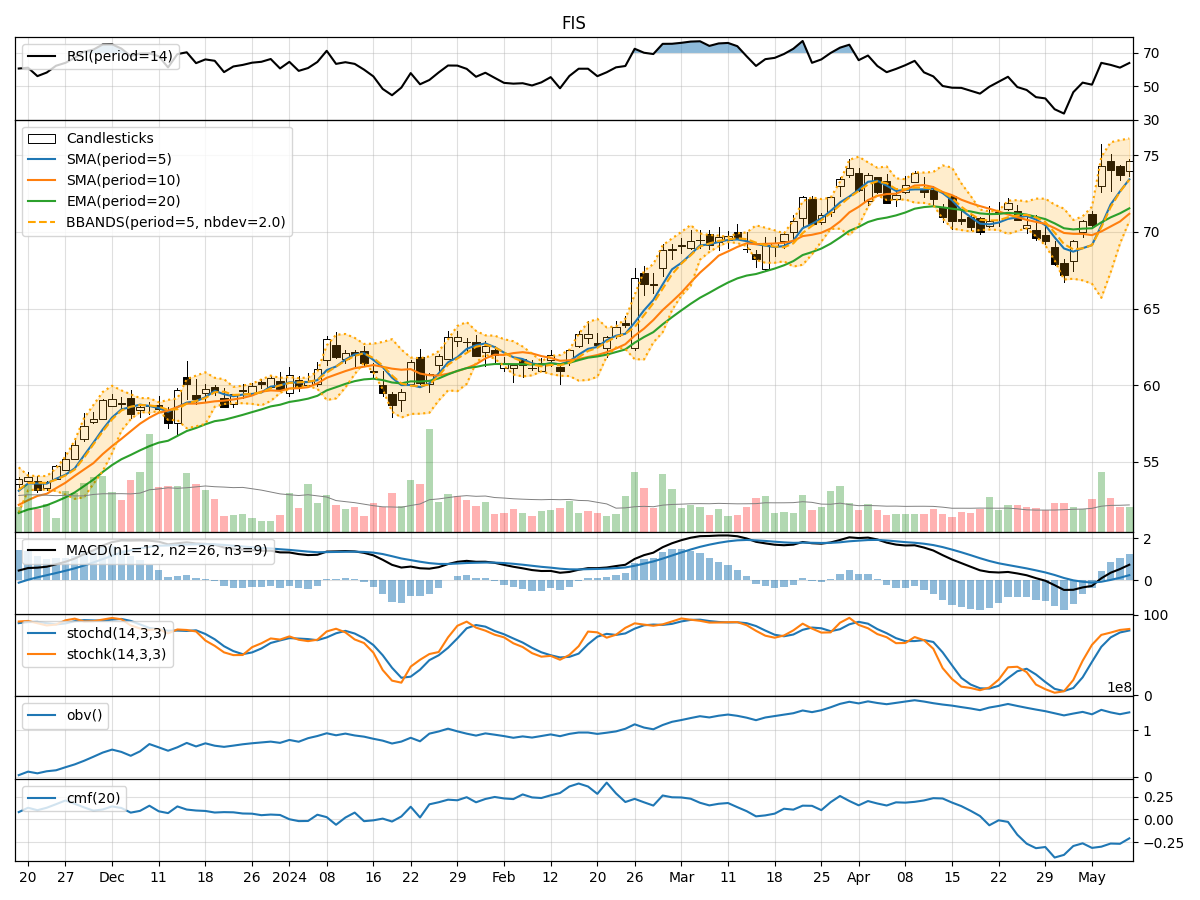
In the last 5 trading days, FIS stock has shown a mixed performance with fluctuations in price and volume. By analyzing various technical indicators including trend, momentum, volatility, and volume, we can gain insights into the possible future price movement of FIS stock.
Trend Analysis:
- Moving Averages (MA): The 5-day Moving Average (MA) has been consistently increasing, indicating a bullish trend in the short term.
- MACD: The MACD line has been above the signal line, suggesting a bullish momentum.
- EMA: The Exponential Moving Average (EMA) has been trending upwards, supporting a bullish outlook.
Key Observation: The trend indicators suggest a bullish sentiment in the short term.
Momentum Analysis:
- RSI: The Relative Strength Index (RSI) has been fluctuating around the neutral level, indicating indecision in the market.
- Stochastic Oscillator: Both %K and %D have been in the overbought zone, suggesting a potential reversal.
- Williams %R: The Williams %R is also in the overbought territory, signaling a possible bearish reversal.
Key Observation: Momentum indicators are mixed, with a slight bearish bias due to overbought conditions.
Volatility Analysis:
- Bollinger Bands (BB): The stock price has been trading near the upper Bollinger Band, indicating high volatility.
- Bollinger Band Width: The Band Width has been narrowing, suggesting a potential decrease in volatility.
Key Observation: Volatility indicators point towards a potential decrease in volatility in the coming days.
Volume Analysis:
- On-Balance Volume (OBV): The OBV has been relatively stable, indicating a balance between buying and selling pressure.
- Chaikin Money Flow (CMF): The CMF has been negative, suggesting a bearish money flow.
Key Observation: Volume indicators show a neutral to bearish sentiment in the market.
Conclusion:
Based on the analysis of technical indicators: - Trend: The trend is upward in the short term. - Momentum: Momentum indicators suggest a potential bearish reversal due to overbought conditions. - Volatility: Volatility is expected to decrease in the near future. - Volume: Volume indicators indicate a neutral to bearish outlook.
Overall View:
Considering the mixed signals from momentum and volume indicators, alongside the bullish trend and decreasing volatility, the next few days for FIS stock are likely to see consolidation or sideways movement with a slight bearish bias. Traders should exercise caution and closely monitor key support and resistance levels for potential entry or exit points.
Remember, market conditions can change rapidly, so it's essential to stay updated with real-time data and adjust your trading strategy accordingly.