Technical Analysis of FLS 2024-05-10
Overview:
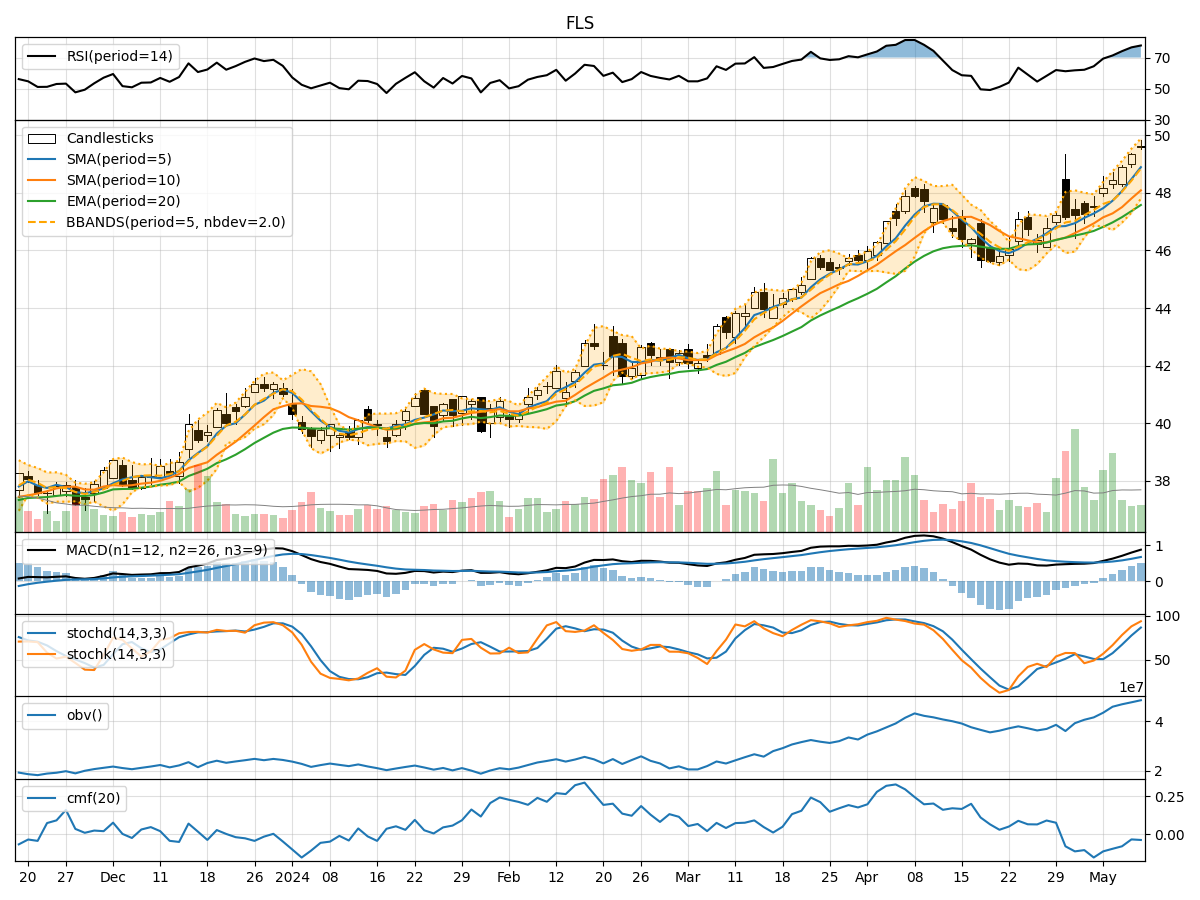
In analyzing the technical indicators for FLS stock over the last 5 days, we will delve into the trend, momentum, volatility, and volume indicators to provide a comprehensive outlook on the possible stock price movement in the coming days. By examining these key indicators, we aim to offer valuable insights and predictions for potential investors.
Trend Analysis:
- Moving Averages (MA): The 5-day Moving Average (MA) has been consistently rising, indicating a bullish trend in the short term.
- MACD: The MACD line has been above the signal line for the past 5 days, suggesting a bullish momentum.
- EMA: The Exponential Moving Average (EMA) has been steadily increasing, supporting the bullish trend.
Key Observation: The trend indicators point towards a strong bullish sentiment in the stock price movement.
Momentum Analysis:
- RSI: The Relative Strength Index (RSI) has been increasing and is currently in the overbought territory, signaling a strong bullish momentum.
- Stochastic Oscillator: Both %K and %D lines of the Stochastic Oscillator are in the overbought zone, indicating a potential reversal.
- Williams %R: The Williams %R is in the oversold region, suggesting a possible correction.
Key Observation: The momentum indicators show conflicting signals with RSI indicating strong bullish momentum while Stochastic and Williams %R hint at a potential reversal.
Volatility Analysis:
- Bollinger Bands: The stock price has been trading near the upper Bollinger Band, indicating high volatility and a potential overbought condition.
- Bollinger Band Width: The Band Width has been narrowing, suggesting a decrease in volatility.
Key Observation: The volatility indicators imply a mixed outlook with high volatility near the upper band but a decreasing overall volatility.
Volume Analysis:
- On-Balance Volume (OBV): The OBV has been steadily increasing, indicating accumulation by investors.
- Chaikin Money Flow (CMF): The CMF has been negative, suggesting selling pressure in the stock.
Key Observation: The volume indicators show conflicting signals with OBV indicating accumulation while CMF points towards selling pressure.
Conclusion:
Based on the analysis of the technical indicators, the stock of FLS is currently exhibiting a strong bullish trend supported by the moving averages and MACD. However, the conflicting signals from momentum, volatility, and volume indicators suggest a potential reversal or consolidation in the near future. Investors should closely monitor the price action for signs of a reversal or continuation of the bullish trend. It is advisable to exercise caution and consider implementing risk management strategies in such a volatile market environment.