Technical Analysis of FLUT 2024-05-10
Overview:
In analyzing the technical indicators for FLUT stock over the last 5 days, we will delve into the trends, momentum, volatility, and volume indicators to provide a comprehensive outlook on the possible stock price movement in the coming days. By examining key metrics such as moving averages, MACD, RSI, Bollinger Bands, and OBV, we aim to offer valuable insights and predictions for potential price action.
Trend Indicators:
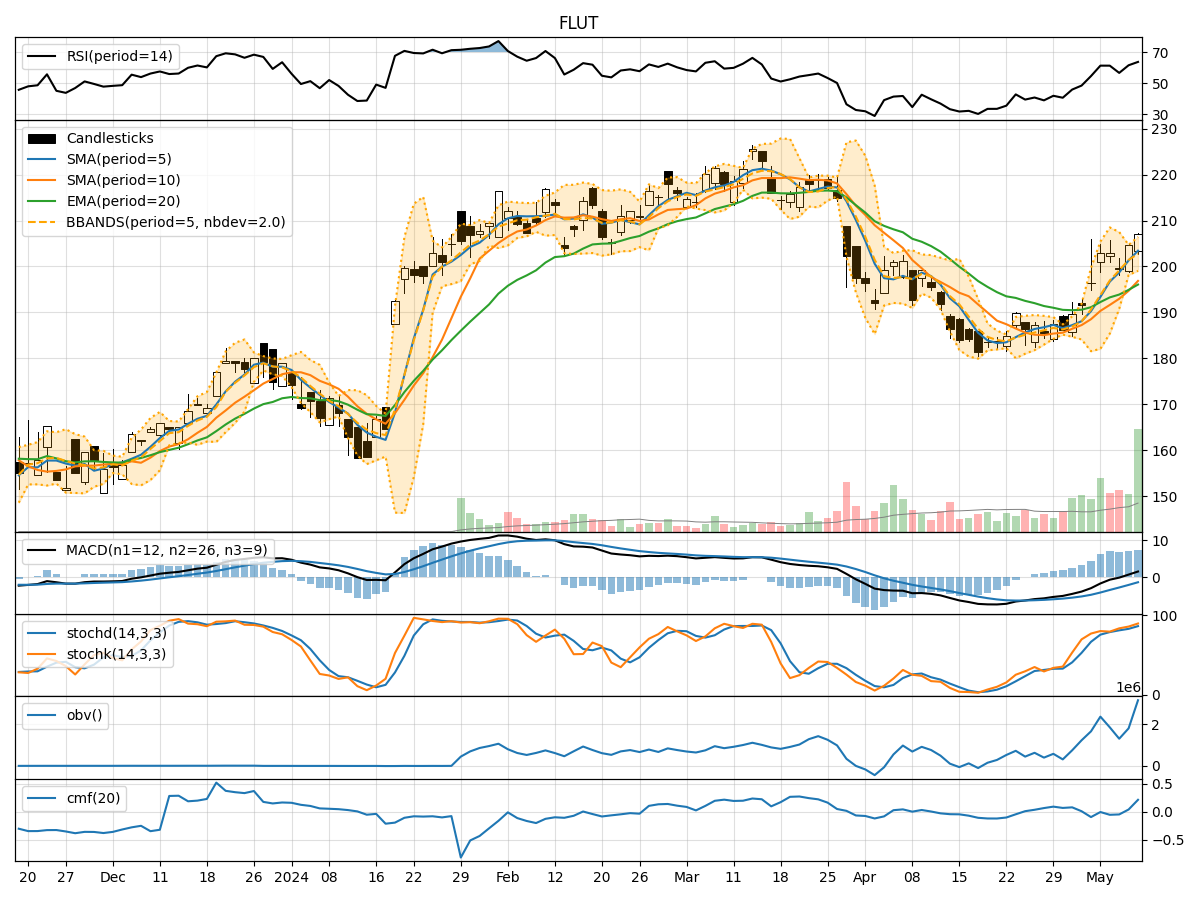
- Moving Averages (MA): The 5-day moving average has been consistently above the longer-term SMAs, indicating a bullish trend.
- MACD: The MACD line has been trending upwards, crossing above the signal line, suggesting bullish momentum.
- EMA: The EMA has been steadily increasing, supporting the bullish sentiment in the short to medium term.
Momentum Indicators:
- RSI: The RSI has been in the overbought territory, indicating strong buying pressure.
- Stochastic Oscillator: Both %K and %D have been rising, signaling increasing buying momentum.
- Williams %R: The indicator has been hovering near oversold levels, suggesting potential buying opportunities.
Volatility Indicators:
- Bollinger Bands: The stock price has been trading near the upper Bollinger Band, indicating high volatility and potential overbought conditions.
- Bollinger Band Width: The BBW has been narrowing, suggesting a potential decrease in volatility.
Volume Indicators:
- On-Balance Volume (OBV): The OBV has been fluctuating but overall showing a positive trend, indicating accumulation by investors.
- Chaikin Money Flow (CMF): The CMF has been negative, indicating some selling pressure, but the 20-day outlook shows a positive trend.
Key Observations and Opinions:
- Trend: The stock is in a strong upward trend supported by moving averages and MACD.
- Momentum: Momentum indicators suggest bullish momentum with potential buying opportunities.
- Volatility: High volatility near the upper Bollinger Band may indicate a potential pullback or consolidation.
- Volume: Accumulation indicated by OBV and positive CMF suggests bullish sentiment among investors.
Conclusion:
Based on the analysis of technical indicators, the next few days for FLUT stock are likely to see continued upward movement with potential short-term volatility and a possible pullback due to overbought conditions. Investors should consider taking advantage of buying opportunities during any dips while maintaining a cautious approach towards high volatility levels. Overall, the outlook remains bullish with a potential for further price appreciation in the near term.