Technical Analysis of FNB 2024-05-10
Overview:
In analyzing the technical indicators for FNB over the last 5 days, we will delve into the trend, momentum, volatility, and volume indicators to provide a comprehensive outlook on the possible stock price movement in the coming days. By examining these key indicators, we aim to offer valuable insights and predictions for informed decision-making.
Trend Analysis:
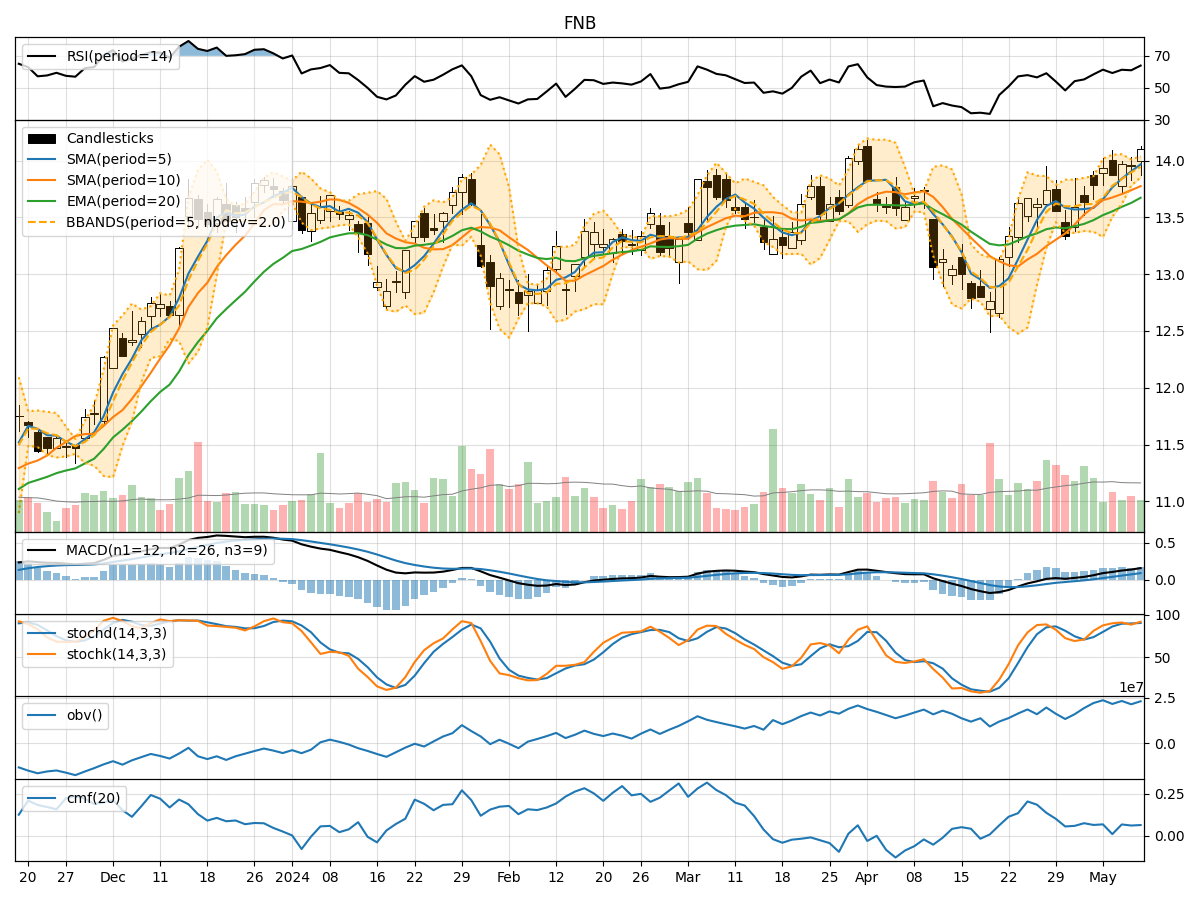
- Moving Averages (MA): The 5-day Moving Average (MA) has been consistently above the Simple Moving Average (SMA) and Exponential Moving Average (EMA), indicating a bullish trend.
- MACD: The MACD line has been consistently above the signal line, suggesting a bullish momentum in the stock price.
Key Observation: The trend indicators point towards a bullish sentiment in the stock price movement.
Momentum Analysis:
- RSI: The Relative Strength Index (RSI) has been fluctuating around the 60-65 range, indicating a neutral momentum.
- Stochastic Oscillator: Both %K and %D have been hovering in the overbought territory, suggesting a potential reversal or consolidation.
Key Observation: The momentum indicators suggest a neutral to slightly bearish momentum in the stock price.
Volatility Analysis:
- Bollinger Bands (BB): The stock price has been trading within the Bollinger Bands, with the bands widening slightly, indicating increased volatility.
Key Observation: Volatility indicators signal increased volatility in the stock price.
Volume Analysis:
- On-Balance Volume (OBV): The OBV has been fluctuating, indicating a balance between buying and selling pressure.
- Chaikin Money Flow (CMF): The CMF has been positive but relatively flat, suggesting a neutral volume trend.
Key Observation: Volume indicators reflect neutral volume in the stock.
Conclusion:
Based on the analysis of the technical indicators, the next few days' possible stock price movement for FNB is likely to be sideways with a slight bearish bias. The trend indicators point towards a bullish sentiment, while momentum indicators suggest a neutral to slightly bearish momentum. Increased volatility may lead to fluctuations in the stock price, while volume indicators indicate a balance between buying and selling pressure.
Key Conclusion: The overall outlook suggests a sideways movement with a slight bearish bias in the coming days for FNB stock. Investors should closely monitor key support and resistance levels for potential trading opportunities.