Technical Analysis of FND 2024-05-10
Overview:
In analyzing the technical indicators for FND over the last 5 days, we will delve into the trend, momentum, volatility, and volume indicators to provide a comprehensive outlook on the possible stock price movement in the coming days. By examining these key aspects, we aim to offer valuable insights and predictions for potential investors.
Trend Indicators:
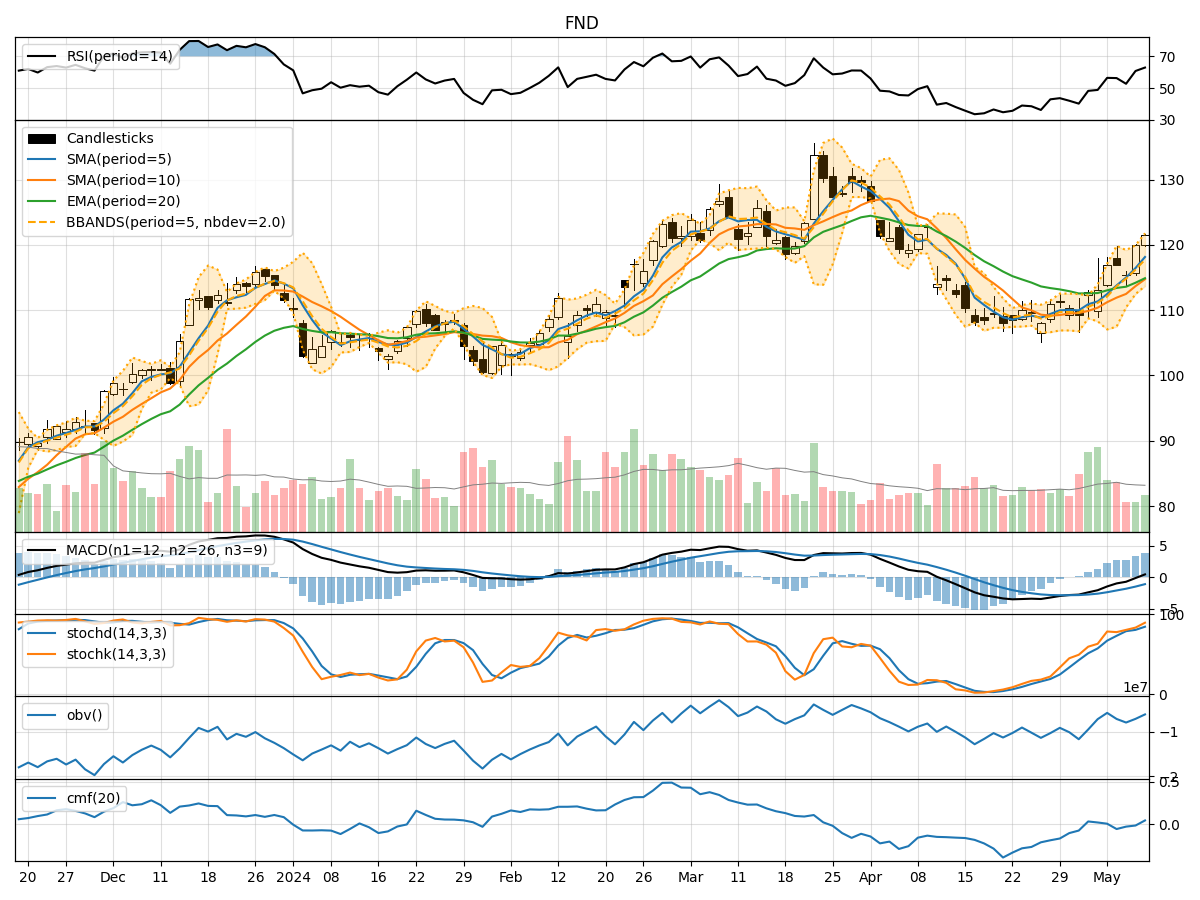
- Moving Averages (MA): The 5-day MA has been consistently rising, indicating a bullish trend in the short term.
- MACD: The MACD line has been above the signal line, suggesting a bullish momentum.
- RSI: The RSI has been fluctuating but generally staying within the neutral range, indicating a balanced market sentiment.
Momentum Indicators:
- Stochastic Oscillator: Both %K and %D have been in the overbought territory, signaling a potential reversal or consolidation.
- Williams %R: The indicator has been hovering around oversold levels, suggesting a possible buying opportunity.
Volatility Indicators:
- Bollinger Bands: The stock price has been trading within the bands, indicating normal volatility.
- BB% (Bollinger Band %B): The %B has been fluctuating around the midline, reflecting a balanced market sentiment.
Volume Indicators:
- On-Balance Volume (OBV): The OBV has shown mixed signals, reflecting indecision among market participants.
- Chaikin Money Flow (CMF): The CMF has been negative, indicating selling pressure in the market.
Key Observations:
- The trend indicators suggest a bullish bias in the short term.
- Momentum indicators point towards a potential reversal or consolidation phase.
- Volatility indicators indicate normal price fluctuations.
- Volume indicators reflect mixed signals with a slight selling pressure.
Conclusion:
Based on the analysis of the technical indicators, the next few days' possible stock price movement for FND is likely to experience consolidation or a sideways trend. Investors should exercise caution and closely monitor key support and resistance levels for potential entry or exit points. It is advisable to wait for clearer signals from the momentum and volume indicators before making significant trading decisions.