Technical Analysis of FOUR 2024-05-10
Overview:
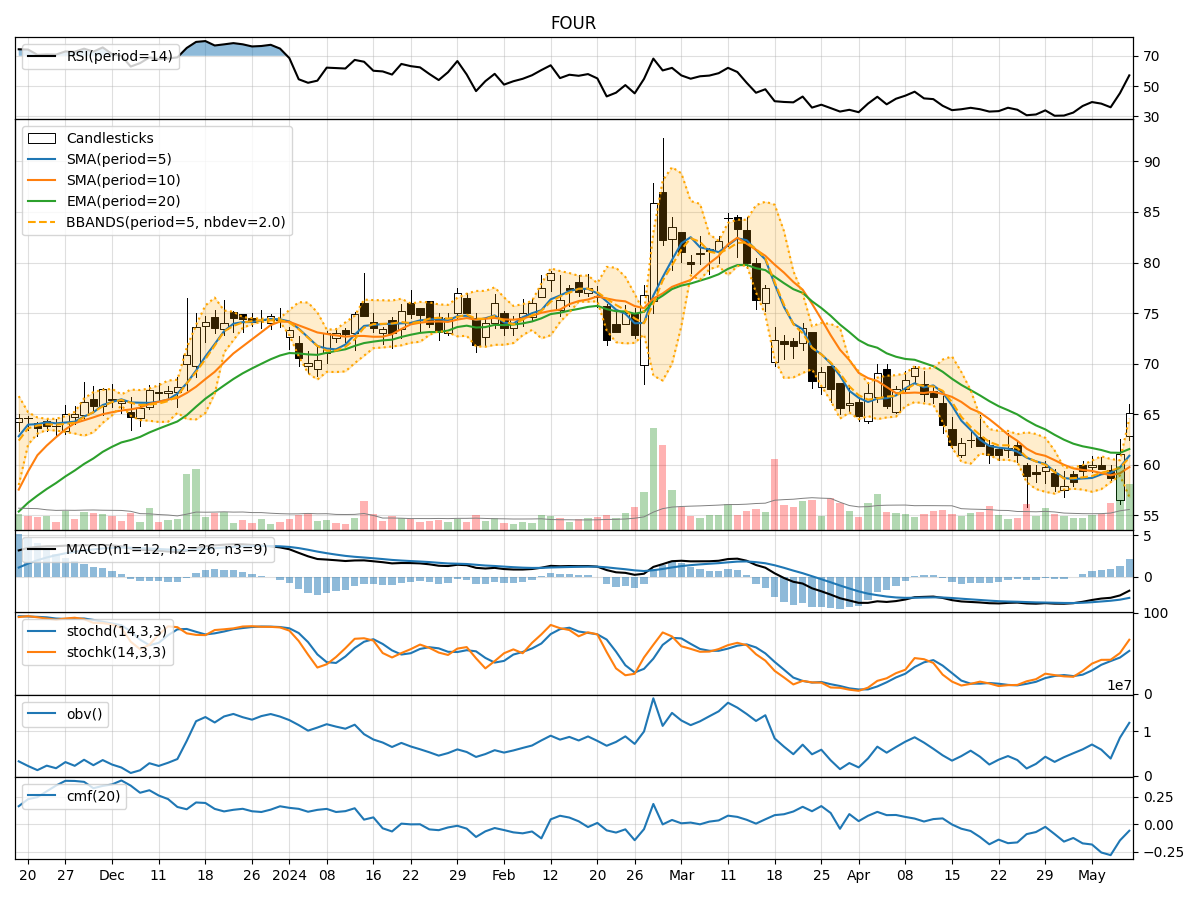
In the last 5 trading days, the stock price has shown some volatility, with fluctuations in both price and volume. The trend indicators suggest a mixed outlook, with the Moving Average Convergence Divergence (MACD) showing a slight positive trend, while the Relative Strength Index (RSI) and Stochastic Oscillator indicate a potential reversal. Volatility indicators show widening Bollinger Bands, indicating increased price volatility. Volume indicators suggest a mixed sentiment, with the On-Balance Volume (OBV) showing some accumulation but the Chaikin Money Flow (CMF) indicating distribution.
Trend Indicators Analysis:
- Moving Averages (MA): The 5-day Moving Average is above the 10-day Simple Moving Average, indicating a short-term bullish trend.
- MACD: The MACD line is positive, suggesting a bullish momentum.
- EMA: The Exponential Moving Average is below the current price, indicating a potential reversal.
- Conclusion: Bullish momentum is present in the short term, but caution is advised as the EMA suggests a possible reversal.
Momentum Indicators Analysis:
- RSI: The RSI is below 50, indicating a bearish sentiment.
- Stochastic Oscillator: Both %K and %D are above 50, suggesting a bullish momentum.
- Williams %R: The indicator is in oversold territory, indicating a potential buying opportunity.
- Conclusion: Mixed signals are present, with RSI indicating bearish sentiment and Stochastic Oscillator suggesting bullish momentum.
Volatility Indicators Analysis:
- Bollinger Bands: The bands are widening, indicating increased price volatility.
- Conclusion: Increased volatility may lead to larger price swings in the coming days.
Volume Indicators Analysis:
- OBV: The On-Balance Volume is showing accumulation, indicating buying pressure.
- CMF: The Chaikin Money Flow is negative, suggesting distribution.
- Conclusion: Mixed signals from volume indicators, with OBV showing accumulation but CMF indicating distribution.
Overall Conclusion:
Based on the analysis of the technical indicators, the stock is currently in a consolidation phase with mixed signals across different indicators. The trend indicators suggest a short-term bullish momentum, while momentum indicators provide conflicting signals. Increased volatility may lead to larger price swings, and volume indicators show a mixed sentiment with accumulation and distribution signals.
Forecast:
Given the current market dynamics and technical indicators, the stock price is likely to experience sideways movement in the next few days. Traders should exercise caution and closely monitor key support and resistance levels for potential entry or exit points. It is advisable to wait for clearer signals from the indicators before making significant trading decisions.