Technical Analysis of FR 2024-05-10
Overview:
In analyzing the technical indicators for FR stock over the last 5 days, we will delve into the trend, momentum, volatility, and volume indicators to provide a comprehensive outlook on the possible stock price movement in the coming days. By examining these key aspects, we aim to offer valuable insights and predictions to guide investment decisions.
Trend Analysis:
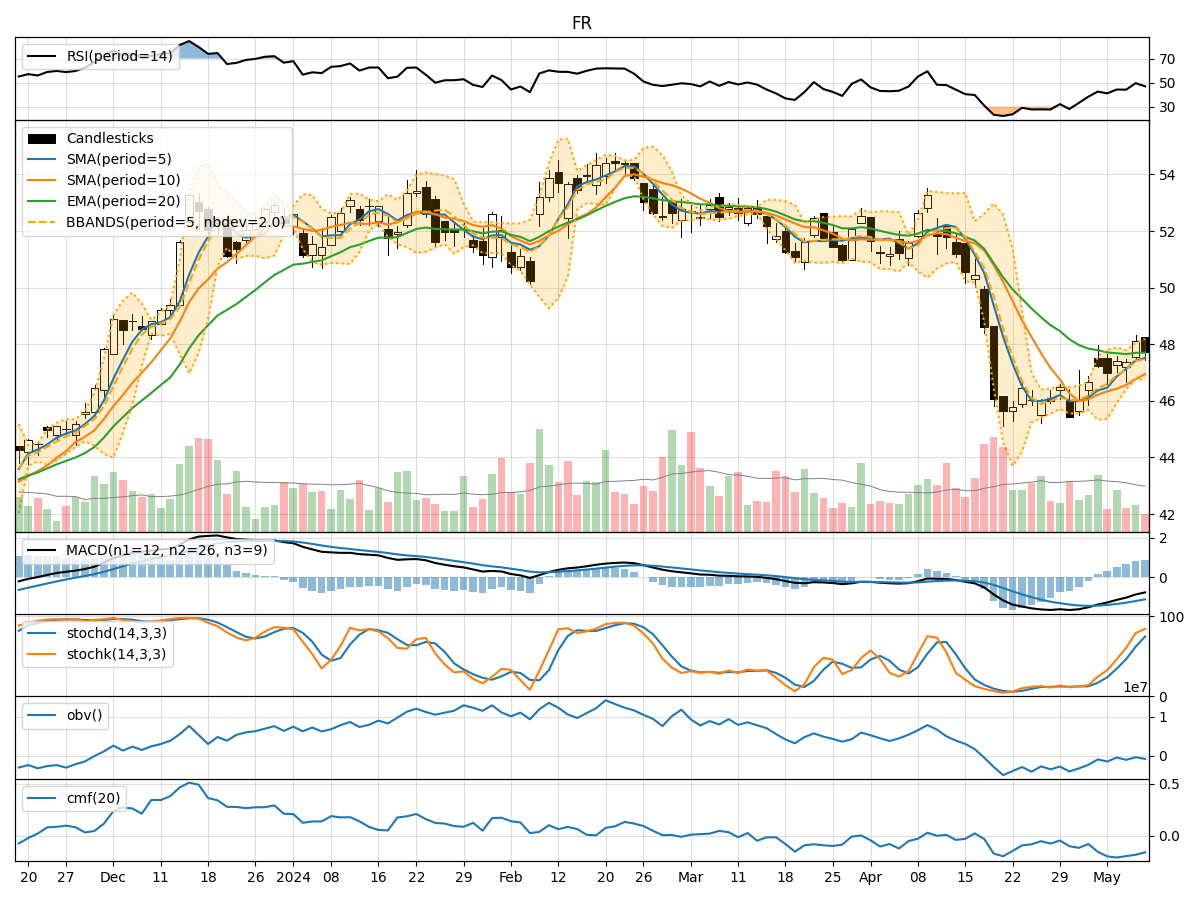
- Moving Averages (MA): The 5-day Moving Average (MA) has been consistently above the Simple Moving Average (SMA) and Exponential Moving Average (EMA), indicating a short-term uptrend.
- MACD: The MACD line has been negative but showing signs of convergence with the signal line, suggesting a potential reversal in the trend.
- MACD Histogram: The MACD Histogram has been gradually decreasing but remains above the zero line, indicating a weakening bullish momentum.
Momentum Analysis:
- RSI: The Relative Strength Index (RSI) has been fluctuating within the neutral zone, indicating indecision in the market.
- Stochastic Oscillator: Both %K and %D lines of the Stochastic Oscillator have been in the overbought zone, suggesting a possible reversal or consolidation.
- Williams %R: The Williams %R is in the oversold territory, indicating a potential buying opportunity.
Volatility Analysis:
- Bollinger Bands (BB): The stock price has been trading within the Bollinger Bands, with the bands narrowing, indicating decreasing volatility.
- Bollinger %B: The %B indicator is below 1, suggesting the stock is trading below the lower band, potentially indicating an oversold condition.
Volume Analysis:
- On-Balance Volume (OBV): The OBV has been fluctuating, indicating mixed buying and selling pressure.
- Chaikin Money Flow (CMF): The CMF has been negative, suggesting outflow of money from the stock.
Conclusion:
Based on the analysis of the technical indicators, the stock is currently in a consolidation phase with mixed signals across different indicators. The trend is showing signs of a potential reversal, supported by the convergence of the MACD lines. However, the momentum indicators are mixed, with the RSI indicating indecision and the Stochastic Oscillator suggesting a possible reversal. The volatility is decreasing, as seen in the narrowing Bollinger Bands, while the volume indicators reflect mixed buying and selling pressure.
Outlook:
Given the current market dynamics, the stock is likely to experience sideways movement in the near term, with a potential for a minor correction or consolidation before establishing a clear trend. Investors should closely monitor the MACD for a bullish crossover confirmation and the Stochastic Oscillator for a reversal signal. Additionally, keeping an eye on the OBV and CMF for any significant shifts in buying or selling pressure would be crucial in determining the stock's future direction.