Technical Analysis of FTI 2024-05-10
Overview:
In analyzing the technical indicators for FTI over the last 5 days, we will delve into the trend, momentum, volatility, and volume indicators to provide a comprehensive outlook on the possible stock price movement in the coming days.
Trend Analysis:
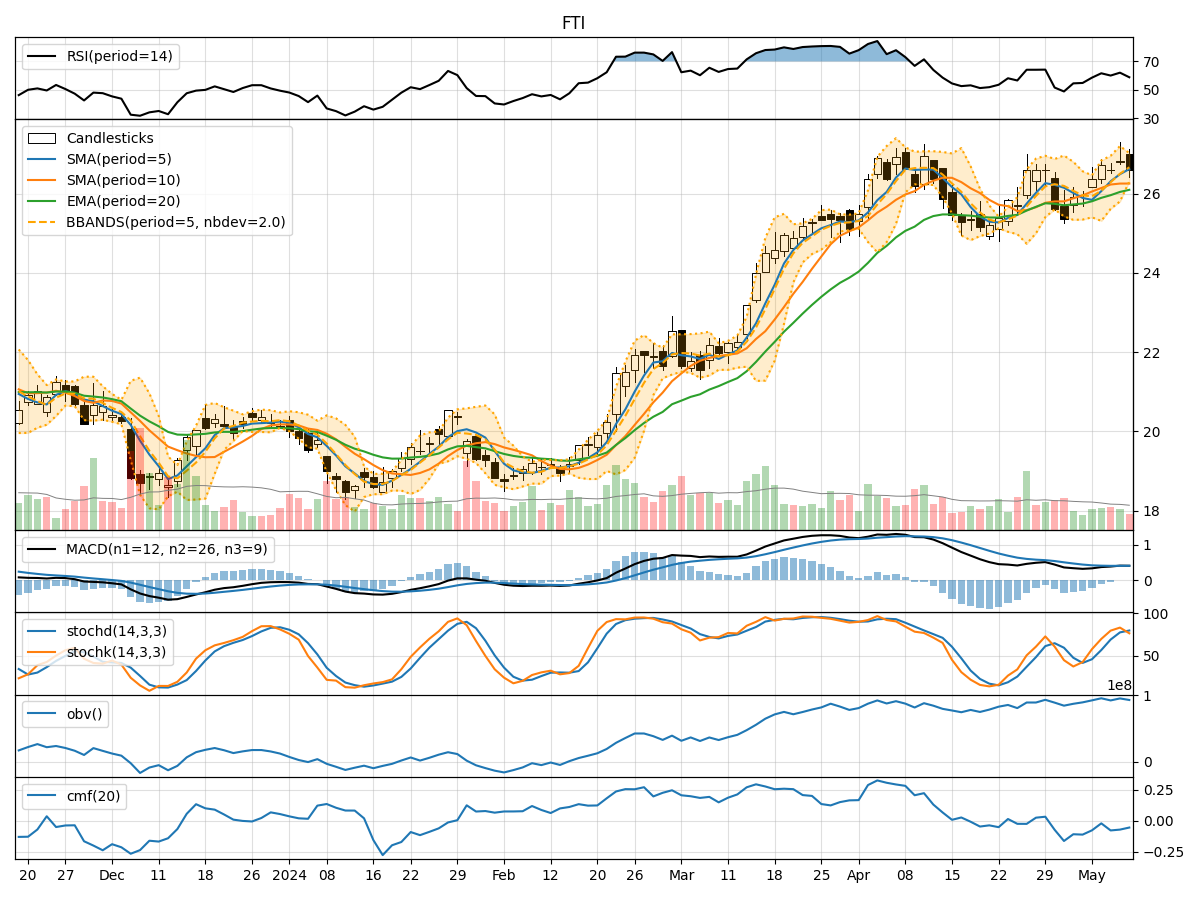
- Moving Averages (MA): The 5-day Moving Average (MA) has been consistently above the Simple Moving Average (SMA) and Exponential Moving Average (EMA), indicating a bullish trend.
- MACD: The MACD line has been above the signal line, with both lines showing a positive trend, suggesting further upward momentum.
- Conclusion: The trend indicators point towards an upward trend in the stock price.
Momentum Analysis:
- RSI: The Relative Strength Index (RSI) has been fluctuating around the 60 level, indicating moderate momentum in the stock.
- Stochastic Oscillator: Both %K and %D have been in the overbought zone, suggesting a potential reversal or consolidation.
- Conclusion: The momentum indicators signal a neutral to slightly bearish momentum in the stock.
Volatility Analysis:
- Bollinger Bands (BB): The stock price has been trading within the Bollinger Bands, with the bands narrowing, indicating decreasing volatility.
- Conclusion: Volatility indicators suggest a low volatility environment for the stock.
Volume Analysis:
- On-Balance Volume (OBV): The OBV has been relatively stable, indicating a balance between buying and selling pressure.
- Chaikin Money Flow (CMF): The CMF has been negative, suggesting outflow of money from the stock.
- Conclusion: Volume indicators point towards neutral volume activity in the stock.
Overall Conclusion:
Based on the analysis of trend, momentum, volatility, and volume indicators, the stock price is likely to continue its upward trend in the short term due to the bullish trend indicators. However, the momentum indicators suggest a potential for a short-term pullback or consolidation given the overbought levels in the stochastic oscillator. The low volatility environment and neutral volume activity further support the view of a potential consolidation phase in the coming days.
Recommendation:
- Short-Term Traders: Consider taking profits or tightening stop-loss levels as the stock may experience a short-term pullback.
- Long-Term Investors: Hold onto positions with a focus on the bullish trend, but monitor closely for any signs of reversal in momentum indicators.
Key Takeaways:
- Upward Trend: Trend indicators signal an upward trend.
- Momentum: Momentum indicators suggest a neutral to slightly bearish momentum.
- Volatility: Low volatility environment indicates stability.
- Volume: Volume indicators point towards neutral volume activity.
Disclaimer:
This analysis is based on technical indicators and historical data, and actual market movements may vary. It is essential to consider other factors and conduct thorough research before making investment decisions. Consulting with a financial advisor is recommended for personalized investment advice tailored to individual risk tolerance and financial goals.