Technical Analysis of GB 2024-05-10
Overview:
In analyzing the technical indicators for the stock GB over the last 5 days, we will delve into the trends, momentum, volatility, and volume indicators to provide a comprehensive outlook on the possible stock price movement in the coming days. By examining these key indicators, we aim to offer valuable insights and predictions for potential investors.
Trend Indicators:
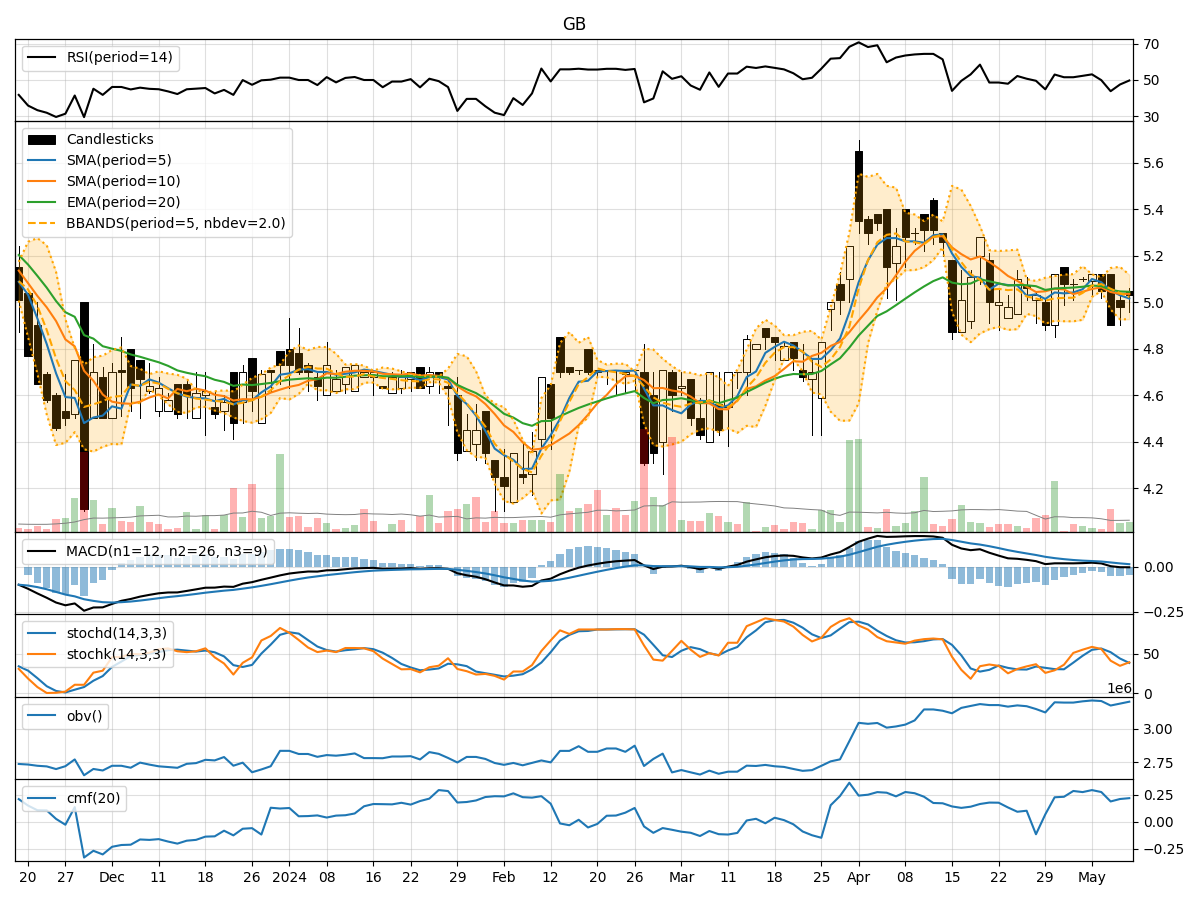
- Moving Averages (MA): The 5-day Moving Average (MA) has been fluctuating around the closing prices, indicating short-term price trends. The Simple Moving Average (SMA) and Exponential Moving Average (EMA) show a slight downward trend, suggesting a bearish sentiment.
- Moving Average Convergence Divergence (MACD): The MACD and Signal Line have been negative, indicating a bearish momentum in the stock price.
- Conclusion: The trend indicators suggest a bearish outlook for the stock in the short term.
Momentum Indicators:
- Relative Strength Index (RSI): The RSI has been hovering around the neutral zone, indicating a lack of strong momentum in either direction.
- Stochastic Oscillator: Both %K and %D have been declining, suggesting a weakening momentum.
- Williams %R (Willams %R): The Williams %R is also in the oversold territory, indicating a potential reversal.
- Conclusion: The momentum indicators point towards a neutral to bearish sentiment in the stock.
Volatility Indicators:
- Bollinger Bands (BB): The Bollinger Bands have been narrowing, indicating decreasing volatility in the stock price.
- Conclusion: The volatility indicators suggest a consolidation phase in the stock, with a potential breakout in either direction.
Volume Indicators:
- On-Balance Volume (OBV): The OBV has been fluctuating, indicating mixed buying and selling pressure.
- Chaikin Money Flow (CMF): The CMF has been positive but declining, suggesting a weakening buying pressure.
- Conclusion: The volume indicators reflect a mixed sentiment in the stock, with no clear direction.
Overall Conclusion:
Based on the analysis of the trend, momentum, volatility, and volume indicators, the stock GB is likely to experience further downside pressure in the short term. The bearish trend indicated by the moving averages and MACD, coupled with the lackluster momentum and mixed volume signals, suggest a challenging period ahead for the stock. Traders should exercise caution and consider waiting for more definitive signals before making any investment decisions.