Technical Analysis of GENI 2024-05-10
Overview:
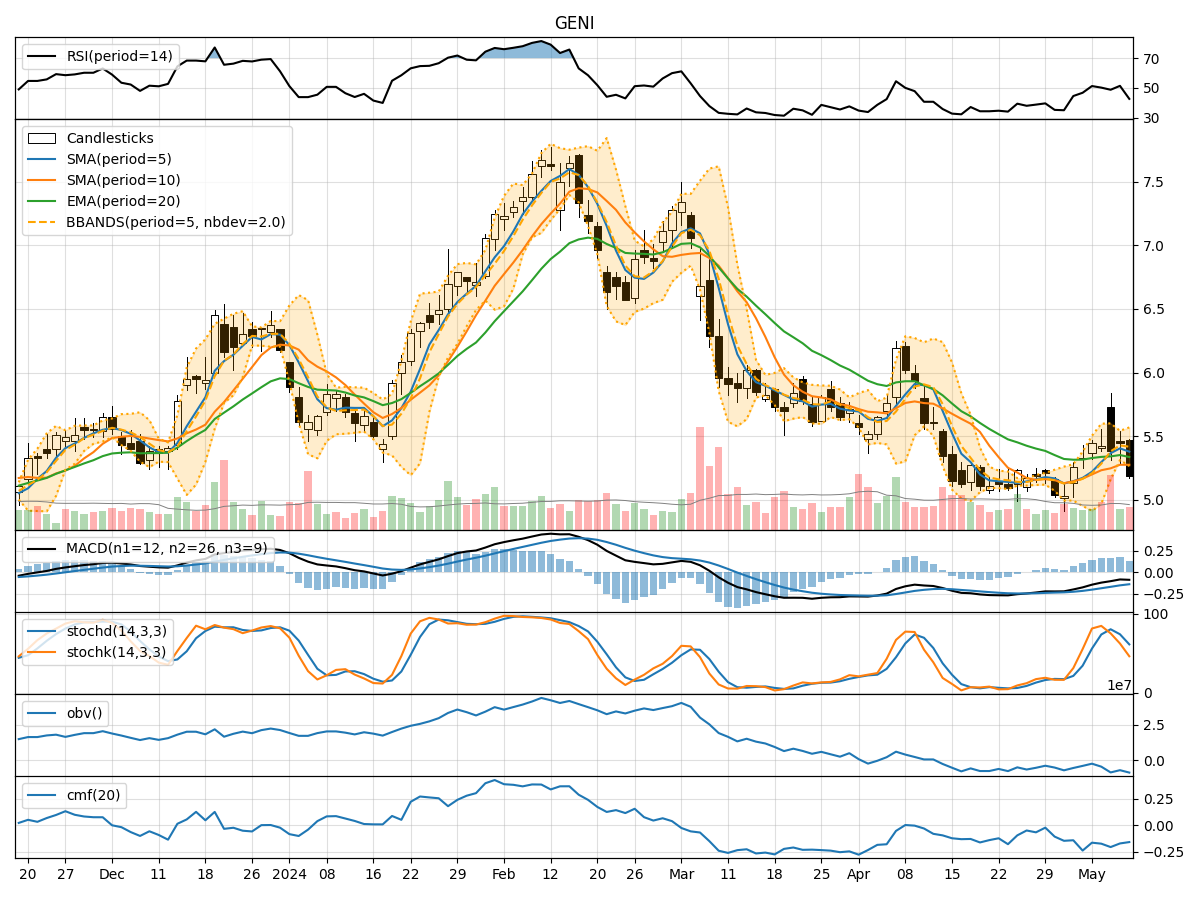
In analyzing the technical indicators for GENI over the last 5 days, we will delve into the trend, momentum, volatility, and volume indicators to provide a comprehensive assessment of the stock's potential price movement. By examining these key factors, we aim to offer valuable insights and predictions for the next few days.
Trend Analysis:
- Moving Averages (MA): The 5-day Moving Average (MA) has been fluctuating around the closing prices, indicating short-term price trends. The Simple Moving Average (SMA) and Exponential Moving Average (EMA) show a slight downward trend, with the EMA lagging behind.
- MACD: The Moving Average Convergence Divergence (MACD) has been negative, suggesting a bearish momentum in the stock price.
- Conclusion: The trend indicators point towards a downward movement in the stock price.
Momentum Analysis:
- RSI: The Relative Strength Index (RSI) has been hovering around the neutral zone, indicating a lack of strong momentum in either direction.
- Stochastic Oscillator: Both %K and %D values have been declining, signaling a weakening momentum.
- Conclusion: The momentum indicators suggest a sideways or weakly bearish momentum in the stock price.
Volatility Analysis:
- Bollinger Bands (BB): The Bollinger Bands have been narrowing, indicating decreasing volatility in the stock price.
- Conclusion: The volatility indicators suggest a low volatility environment for the stock.
Volume Analysis:
- On-Balance Volume (OBV): The OBV has been negative, indicating selling pressure in the stock.
- Chaikin Money Flow (CMF): The CMF has been consistently negative, reflecting a lack of buying interest.
- Conclusion: The volume indicators point towards bearish sentiment in the stock.
Overall Conclusion:
Based on the analysis of trend, momentum, volatility, and volume indicators, the overall outlook for GENI in the next few days is bearish. The trend indicators show a downward trajectory, supported by negative momentum and volume indicators. The low volatility suggests a lack of significant price movements, while the volume indicators confirm the selling pressure in the stock.
Recommendation:
Considering the bearish outlook, investors may consider short-term selling or avoiding long positions until there is a clear reversal in the technical indicators. It is essential to monitor the price action closely and wait for signals of a potential trend reversal before considering any bullish positions.
Disclaimer:
Please note that technical analysis is not a guaranteed predictor of future price movements, and other fundamental factors can influence stock prices. It is crucial to conduct thorough research and consider multiple indicators before making any investment decisions. Consulting with a financial advisor is recommended for personalized investment advice tailored to individual risk tolerance and financial goals.