Technical Analysis of GFI 2024-05-10
Overview:
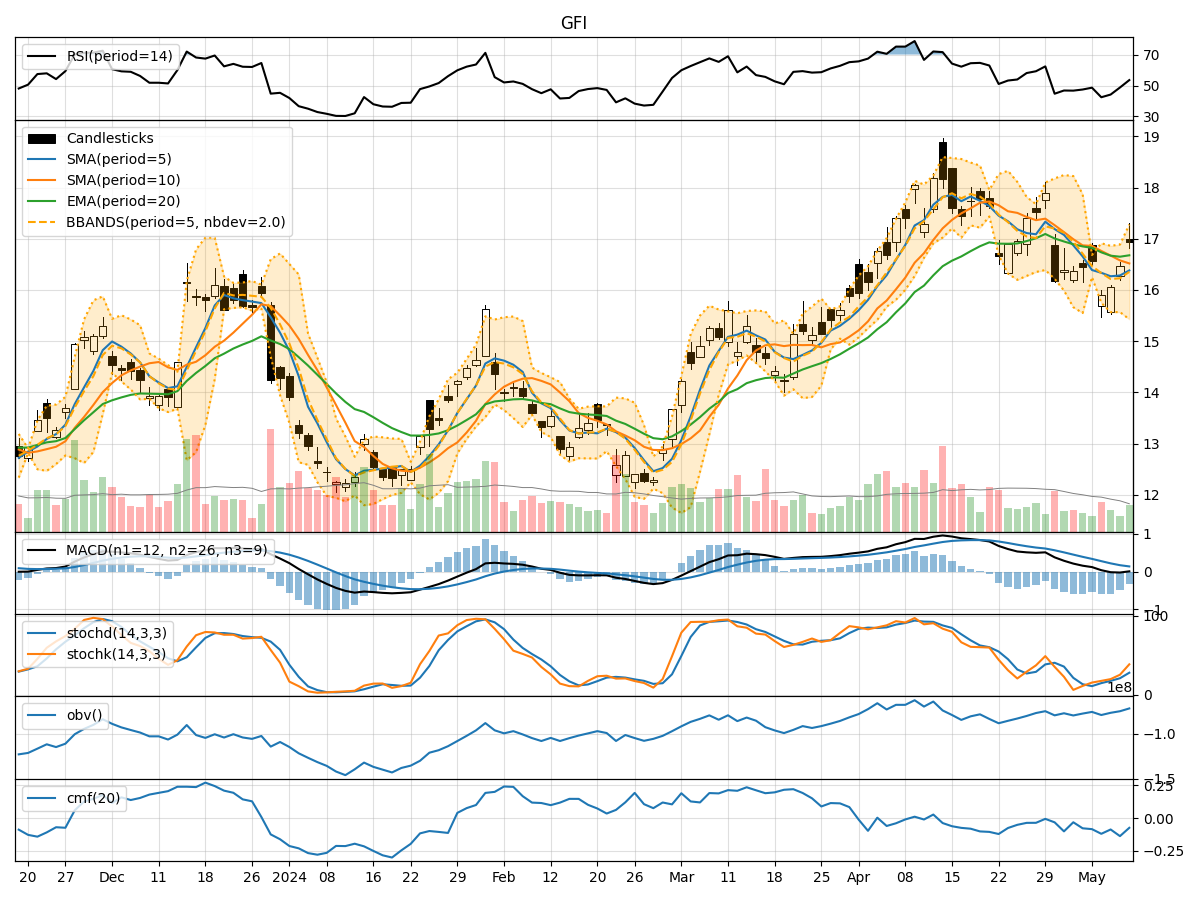
In analyzing the technical indicators for GFI over the last 5 days, we will delve into the trend, momentum, volatility, and volume indicators to provide a comprehensive outlook on the possible stock price movement in the coming days. By examining these key aspects, we aim to offer valuable insights and predictions for informed decision-making.
Trend Analysis:
- Moving Averages (MA): The 5-day Moving Average (MA) has been fluctuating around the closing prices, indicating a short-term trend. The Simple Moving Average (SMA) and Exponential Moving Average (EMA) show a slight downward trend, with the EMA lagging behind.
- MACD: The Moving Average Convergence Divergence (MACD) and its signal line (MACDH) have been negative, suggesting a bearish momentum in the short term.
Momentum Analysis:
- RSI: The Relative Strength Index (RSI) has been hovering around the midline, indicating a neutral momentum with no clear overbought or oversold conditions.
- Stochastic Oscillator: Both %K and %D lines of the Stochastic Oscillator are on an upward trajectory, signaling a potential bullish momentum.
- Williams %R: The Williams %R is in the oversold territory, suggesting a possible reversal or buying opportunity.
Volatility Analysis:
- Bollinger Bands (BB): The Bollinger Bands are widening, indicating increased volatility in the stock price. The current price is closer to the upper band, suggesting a potential overbought condition.
- Bollinger %B: The %B indicator is above 0.8, indicating a relatively high price compared to the recent past.
Volume Analysis:
- On-Balance Volume (OBV): The OBV has been fluctuating, showing no clear trend in volume accumulation or distribution.
- Chaikin Money Flow (CMF): The CMF is negative, indicating a bearish money flow in the stock.
Key Observations and Opinions:
- Trend: The trend indicators suggest a short-term bearish bias, with moving averages and MACD signaling a potential downward movement.
- Momentum: The momentum indicators are mixed, with the Stochastic Oscillator showing a bullish signal while RSI and Williams %R indicate a neutral to oversold condition.
- Volatility: Increased volatility as per Bollinger Bands could lead to sharp price movements, potentially indicating a period of uncertainty.
- Volume: The volume indicators do not provide a clear direction, reflecting indecision among market participants.
Conclusion:
Based on the analysis of technical indicators, the outlook for GFI in the next few days leans towards a downward movement. The trend indicators, supported by the bearish MACD, suggest a potential continuation of the current bearish trend. While some momentum indicators show conflicting signals, the overall picture points towards a cautious approach. Traders and investors should closely monitor price action and key support levels for any potential reversal or confirmation of the bearish bias.