Technical Analysis of GFL 2024-05-10
Overview:
In analyzing the technical indicators for GFL over the last 5 days, we will delve into the trend, momentum, volatility, and volume indicators to provide a comprehensive outlook on the possible stock price movement in the coming days. By examining these key aspects, we aim to offer valuable insights and predictions for informed decision-making.
Trend Analysis:
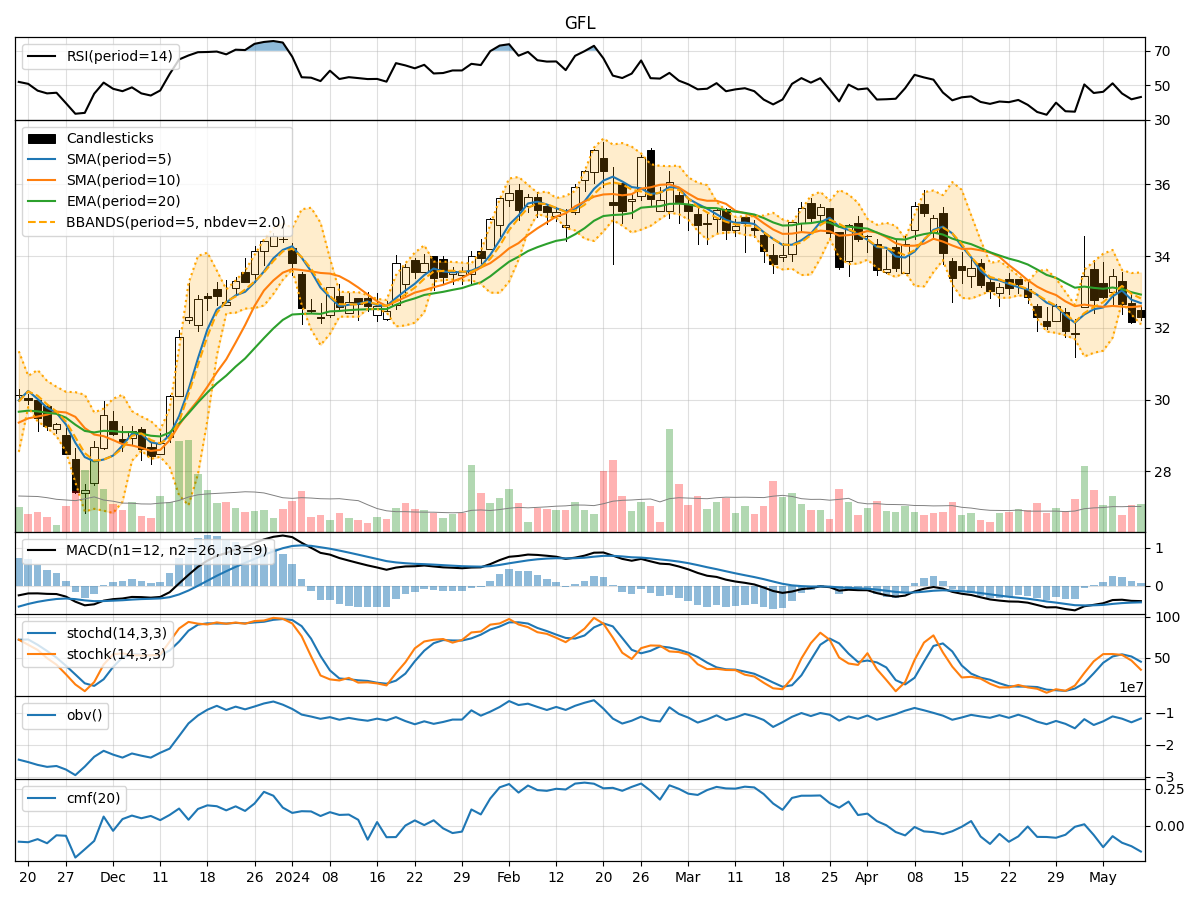
- Moving Averages (MA): The 5-day MA has been fluctuating around the closing prices, indicating short-term price trends. The SMA(10) and EMA(20) have shown slight variations but have not diverged significantly.
- MACD: The MACD line has been consistently below the signal line, suggesting a bearish trend. However, the MACD histogram has shown some convergence in recent days.
Momentum Analysis:
- RSI: The RSI values have been hovering around the mid-range, indicating a neutral momentum with no extreme overbought or oversold conditions.
- Stochastic Oscillator: Both %K and %D have been fluctuating, but recently %K has been below %D, signaling a potential bearish momentum.
- Williams %R (WillR): The Williams %R values have been in the oversold territory, indicating a bearish sentiment.
Volatility Analysis:
- Bollinger Bands (BB): The stock price has been trading within the bands, with no significant breaches. The bands have not shown any widening or narrowing patterns, suggesting stable volatility.
- Bollinger %B (BBP): The %B values have been relatively stable around the mid-range, indicating a balanced volatility level.
Volume Analysis:
- On-Balance Volume (OBV): The OBV values have been fluctuating, indicating mixed buying and selling pressure. The recent downtrend in OBV suggests a potential bearish sentiment.
- Chaikin Money Flow (CMF): The CMF values have been negative, indicating outflows and potential selling pressure in the stock.
Conclusion:
Based on the analysis of the technical indicators, the stock of GFL is currently exhibiting bearish tendencies in both momentum and volume indicators. The trend indicators also suggest a bearish outlook with the MACD line consistently below the signal line. The volatility remains stable, indicating no significant price fluctuations expected in the near term.
Forecast:
Considering the overall analysis, the next few days for GFL are likely to see a downward movement in stock price. Traders and investors should exercise caution and consider potential short-selling opportunities or wait for a more favorable entry point. It is advisable to closely monitor key support levels and consider risk management strategies to navigate the anticipated bearish trend.